
IMRF invites you to read our 2025 Popular Annual Financial Report (PAFR). Derived from IMRF’s 2025 Annual Comprehensive Financial Report (ACFR), the PAFR is consistent with generally accepted accounting principles (GAAP) and shares a summary of our financial condition, highlighting key insights in five sections. Further details can be found in the ACFR. Click the links below to navigate to each section of our 2025 PAFR.
Investments
IMRF’s investment portfolio was valued at $61.7 billion on December 31, 2025.
The portfolio’s 2025 rate of return was 14.7% after investment management fees. The value of the investment portfolio increased $6.4 billion.
The 2025 financial market continued to be positive similar to the 2024 market. The 2025 financial markets increased over 2024 markets impacted by lower inflation, the Federal Reserve’s rate cut, global market dynamics, near steady unemployment, job growth consistent throughout the year, AI-driven sector gains, and U.S. inflation in 2025 was slightly lower than in 2024 but still above the Federal Reserves 2% long term target at 2.7%
In 2025, IMRF’s domestic equity portfolio gained 14.3% after fees, and the international equity portfolio increased to 32.3% after fees. The fixed income portfolio increased to 7.4% after fees. Similarly, IMRF’s real estate portfolio increased to 2.1% after fees, and the alternative investments portfolio returned 15.2% after fees in 2025.
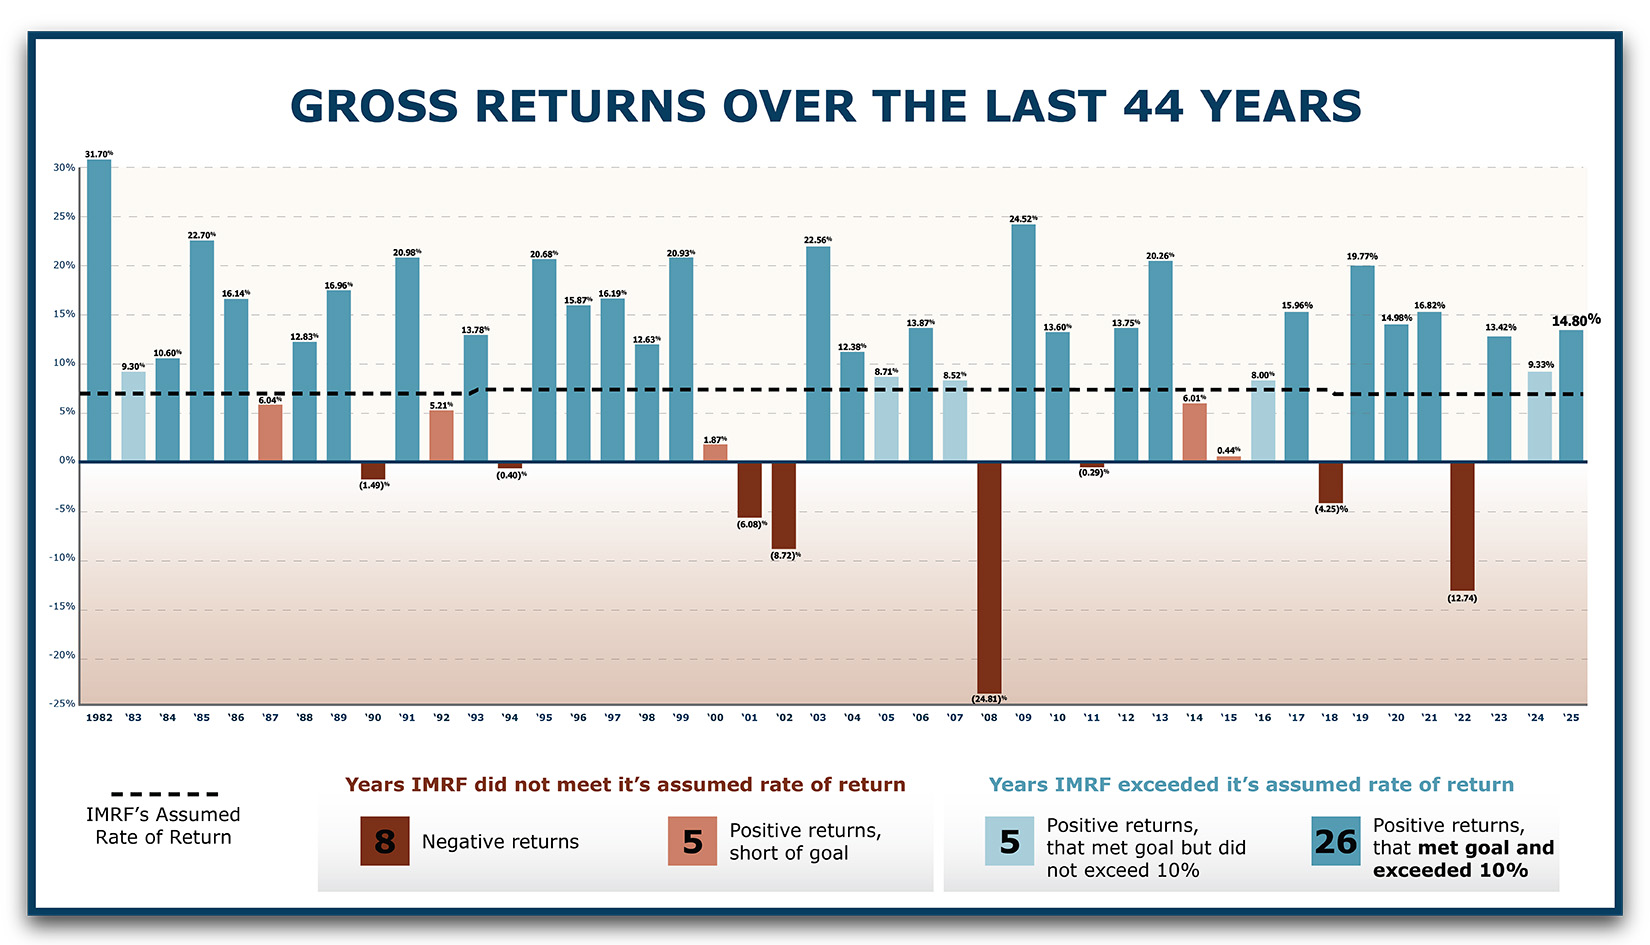
IMRF’s long-term goal is to earn an annualized total fund return of 7.25%, after investment management fees. IMRF achieved this goal in 2025 as well as over longer time horizons. The bar chart below shows IMRF’s returns over the past 44 years, compared to the 7.25% goal.
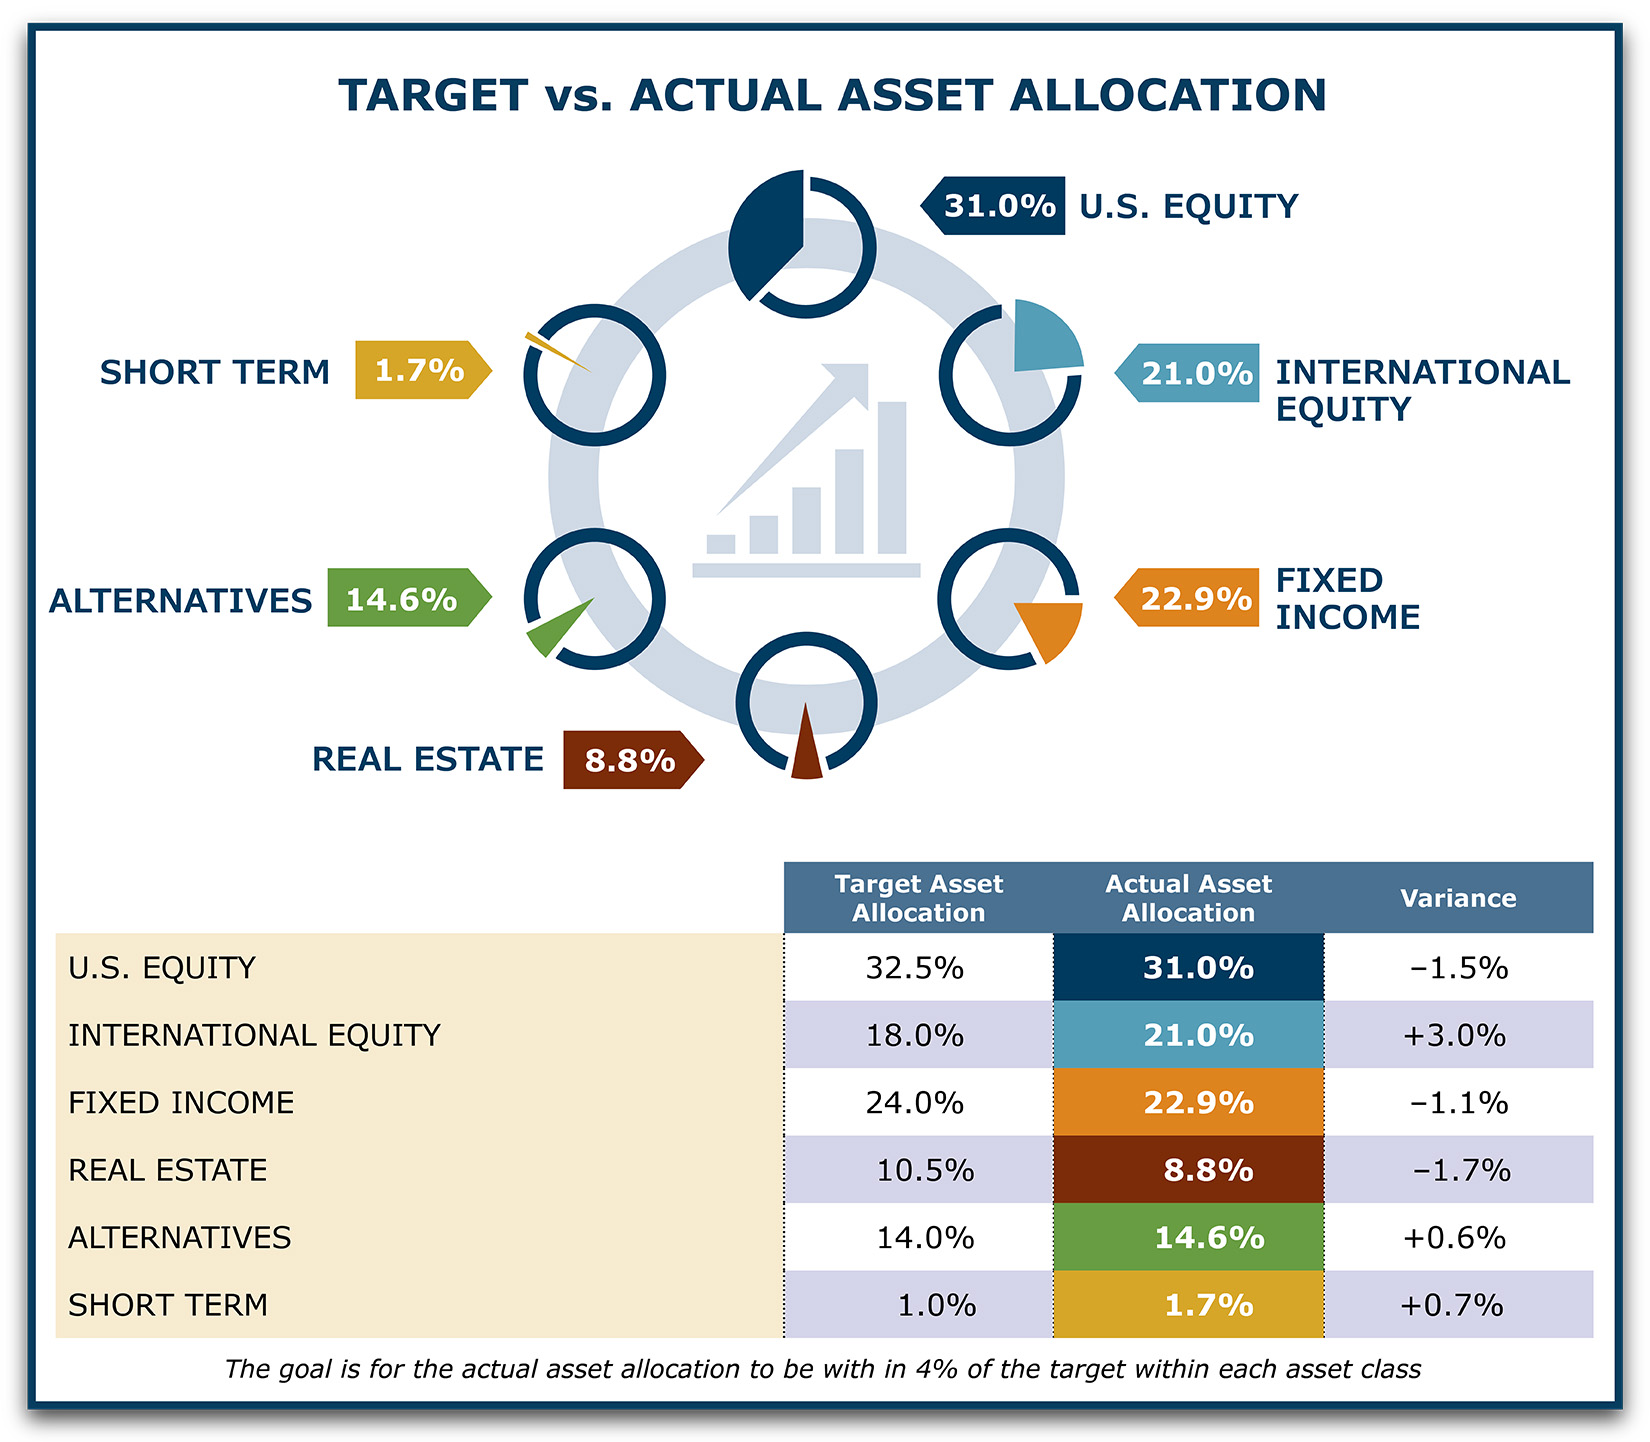
2025 Target vs. Actual Asset Allocation
The IMRF Board of Trustees revised the target asset allocation for the IMRF investment portfolio in 2025. The target allocation has two key goals: maximize return and minimize risk. The Board continually evaluates the portfolio’s target asset allocation and makes adjustments as necessary.
As the value of the assets fluctuates, the portfolio’s actual allocation always varies from the target. The goal is for the actual allocation to be within 4% of the target within each asset class.
On December 31, 2025, the portfolio’s actual allocation was within the prescribed range for all asset classes.
Funding Status
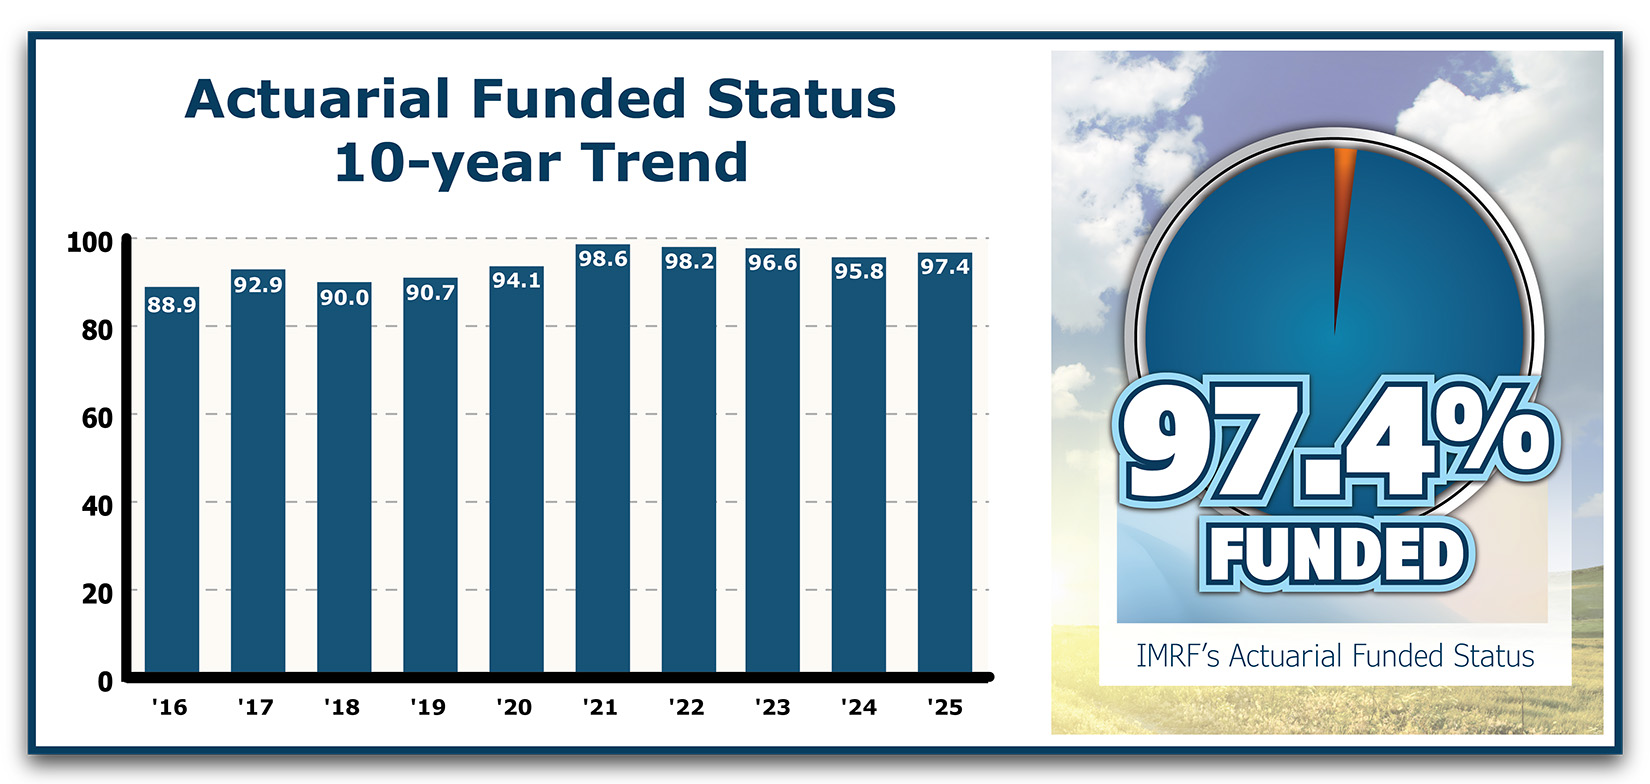
IMRF’s funding status is a key indicator of our overall financial health. It reflects the percentage of promised benefits that IMRF currently has the assets to pay. IMRF strives for 100% funding, because it guarantees that the system can meet its obligations and is most cost effective for taxpayers.
As of December 31, 2025, IMRF was 97.4% funded on an actuarial basis. IMRF's actuarial funding status is determined by independent actuaries using a "smoothing" technique that recognizes investment gains and losses over a five-year period. The actuarial funding status is used to set IMRF contribution rates for participating units of government. Below you will see, IMRF's funded status has remained above 88% since 2015.
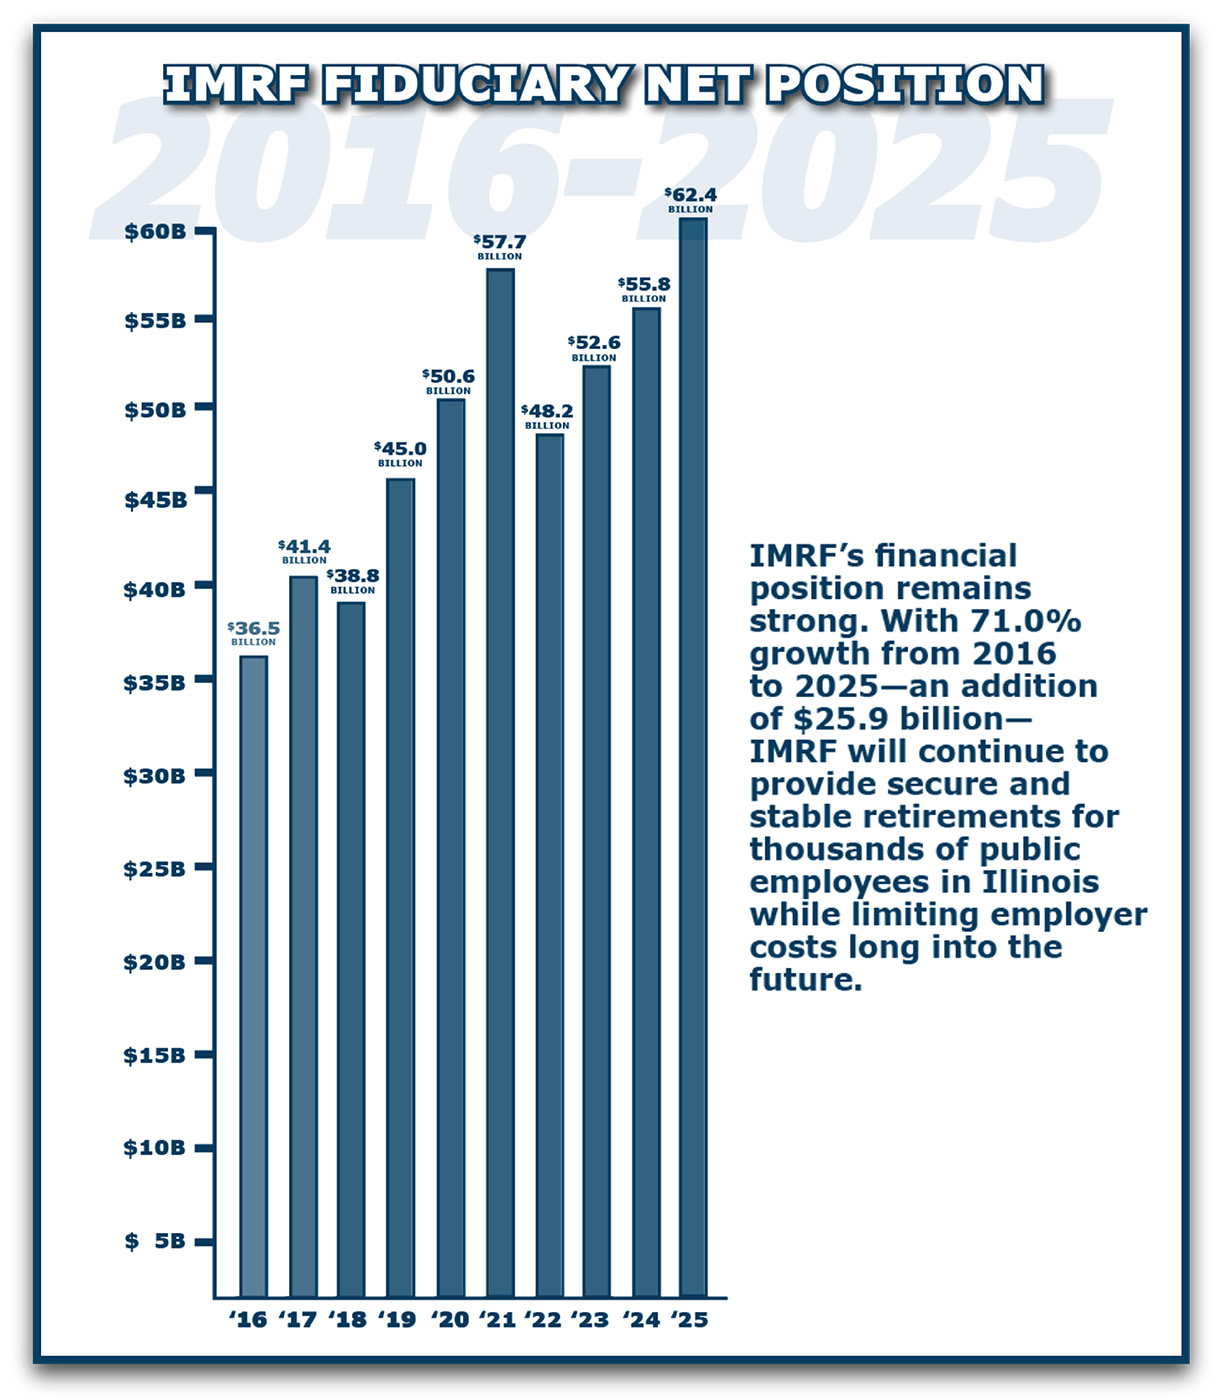
Fiduciary Net Position
IMRF's fiduciary net position—total assets and deferred outflow of resources minus liabilities and deferred inflow of resources—was $62.4 billion as of December 31, 2025. That was an increase of $6.6 billion, or about 11.8%, from 2024. This increase reflects positive investment returns in 2025.
With positive gains in 2025, IMRF’s financial position remains strong. With 71.0% growth from 2016 - 2025, IMRF's long-term investment strategy withstands short-term losses.
Revenue and Expenses
Revenues
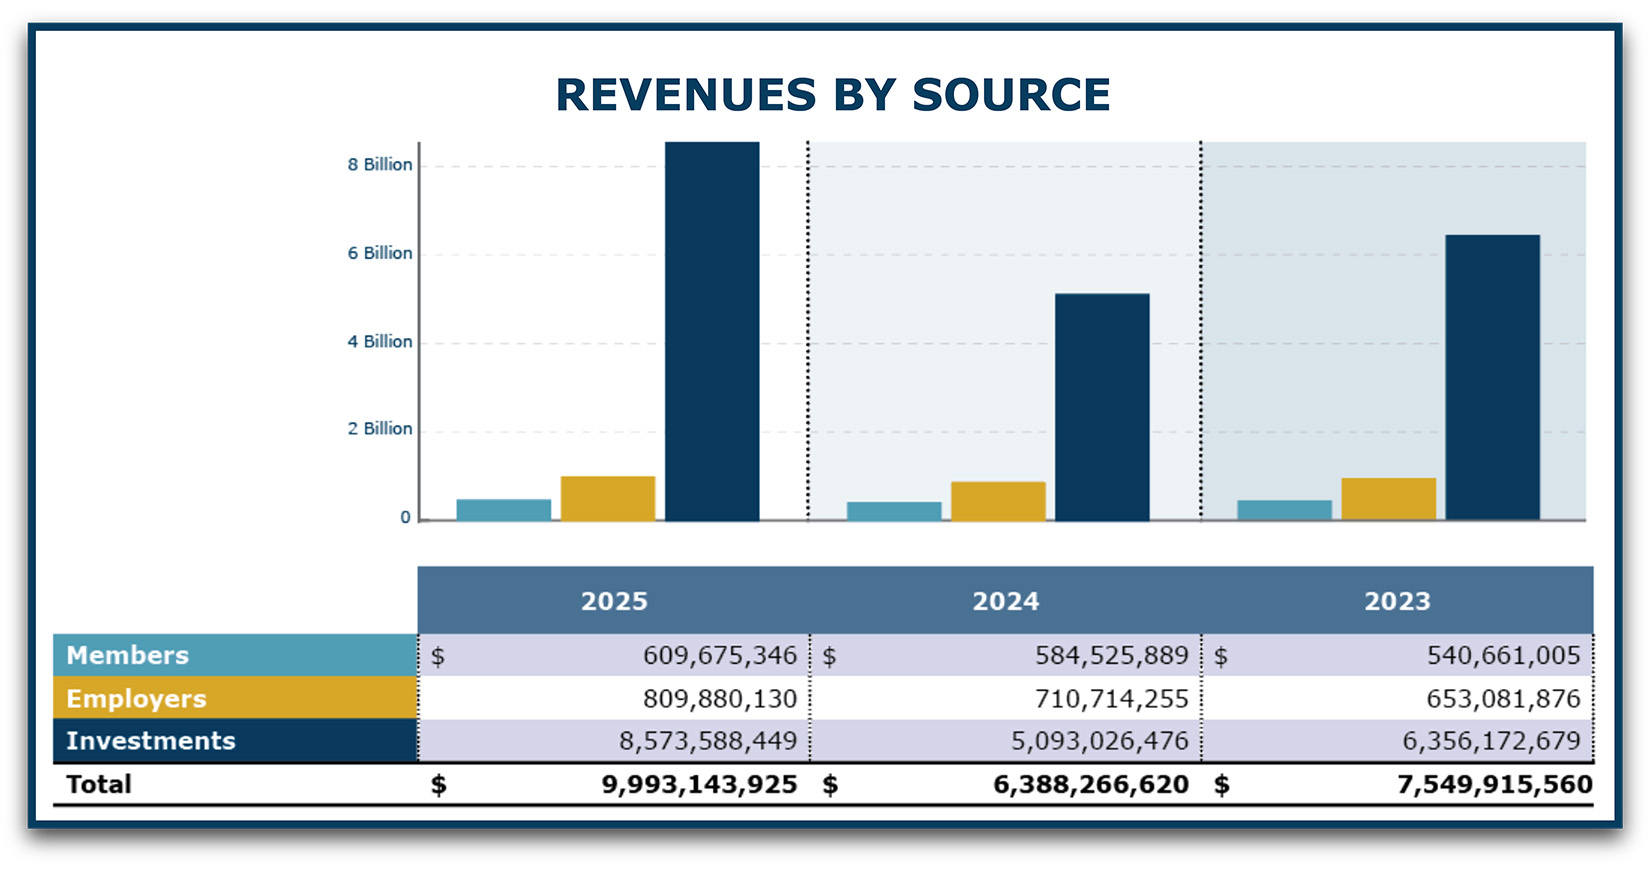
IMRF’s revenue comes from 3 sources: member contributions, IMRF employer contributions (from participating units of government), and investment income. IMRF's total revenue in 2025 was $10.0 billion.
About 98% of IMRF members participate in the Regular Plan. These members pay 4.5% out of every paycheck to fund IMRF benefits. Total member contributions were approximately $610 million in 2025.
All IMRF employers also make monthly payments to support the IMRF benefit system. Each IMRF employer pays an amount calculated by IMRF’s actuary based on its IMRF assets, liabilities, and the demographics of its workforce. Total employer contributions were $810 million in 2025.
Member and employer contributions are invested, and IMRF investment returns have historically accounted for the majority of IMRF’s revenue. In 2025, IMRF investments gained $8.6 billion.
As you can see from the 3-year comparison below, member and employer contributions remain stable while investment returns are historically strong but volatile.
Expenses
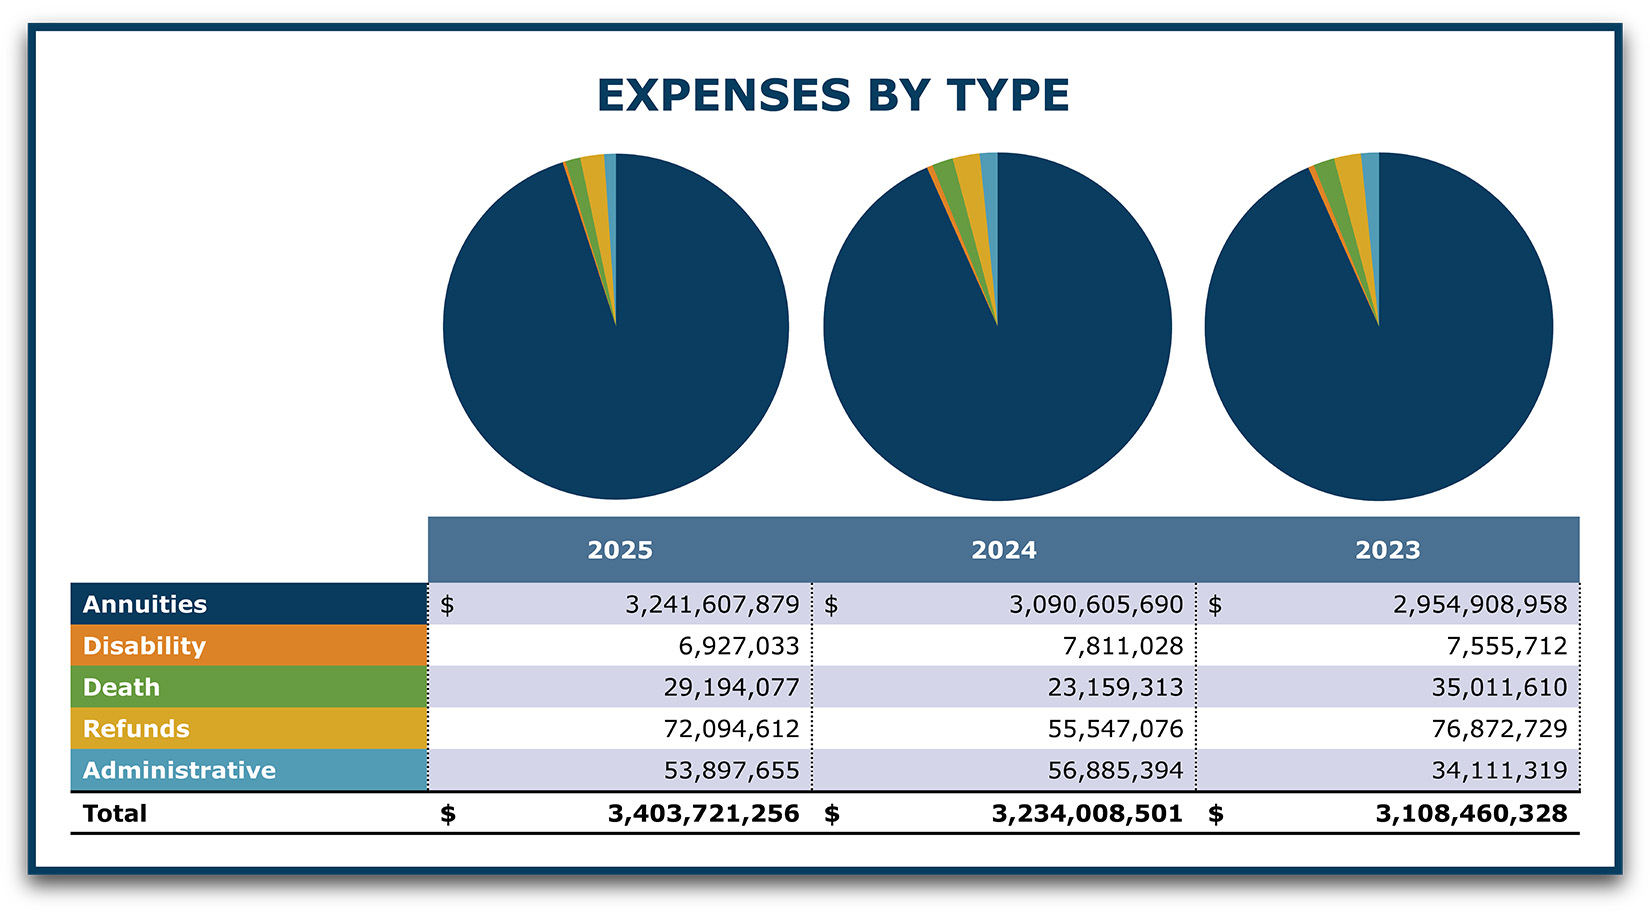
IMRF’s expenses include annuities (pension payments), disability and death benefits, refunds to members, and the cost to administer IMRF’s benefit system. In 2025, IMRF’s total expenses equaled about $3.4 billion.
Total expenses increased by about 5.2% or $170 million from 2024 to 2025.
Members and Employers
IMRF experienced growth in members and an increase in employers in 2025.
Members
Over the last three years, IMRF members increased by 9%, totaling 537,775 active members, inactive members, and retirees in 2025.
| Members | 2025 | 2024 | 2023 |
|---|---|---|---|
| Active | 196,691 | 196,859 | 181,205 |
| Inactive | 181,629 | 169,066 | 157,200 |
| Retirees | 159,455 | 158,379 | 154,554 |
| Grand Total | 537,775 | 524,304 | 492,959 |
The typical IMRF retiree receives a modest benefit, earned after decades of public service.
| Annual Pension Amount | Annuitants |
|---|---|
| Under $1,200 | 3,976 |
| $1,200 to under $3,000 | 13,170 |
| $3,000 to under $6,000 | 24,433 |
| $6,000 to under $9,000 | 20,020 |
| $9,000 to under $12,000 | 15,683 |
| $12,000 to under $24,000 | 36,861 |
| $24,000 to under $36,000 | 17,951 |
| $36,000 to under $48,000 | 10,280 |
| $48,000 to under $60,000 | 6,540 |
| $60,000 to under $72,000 | 4,119 |
| $72,000 and over | 6,422 |
Employers
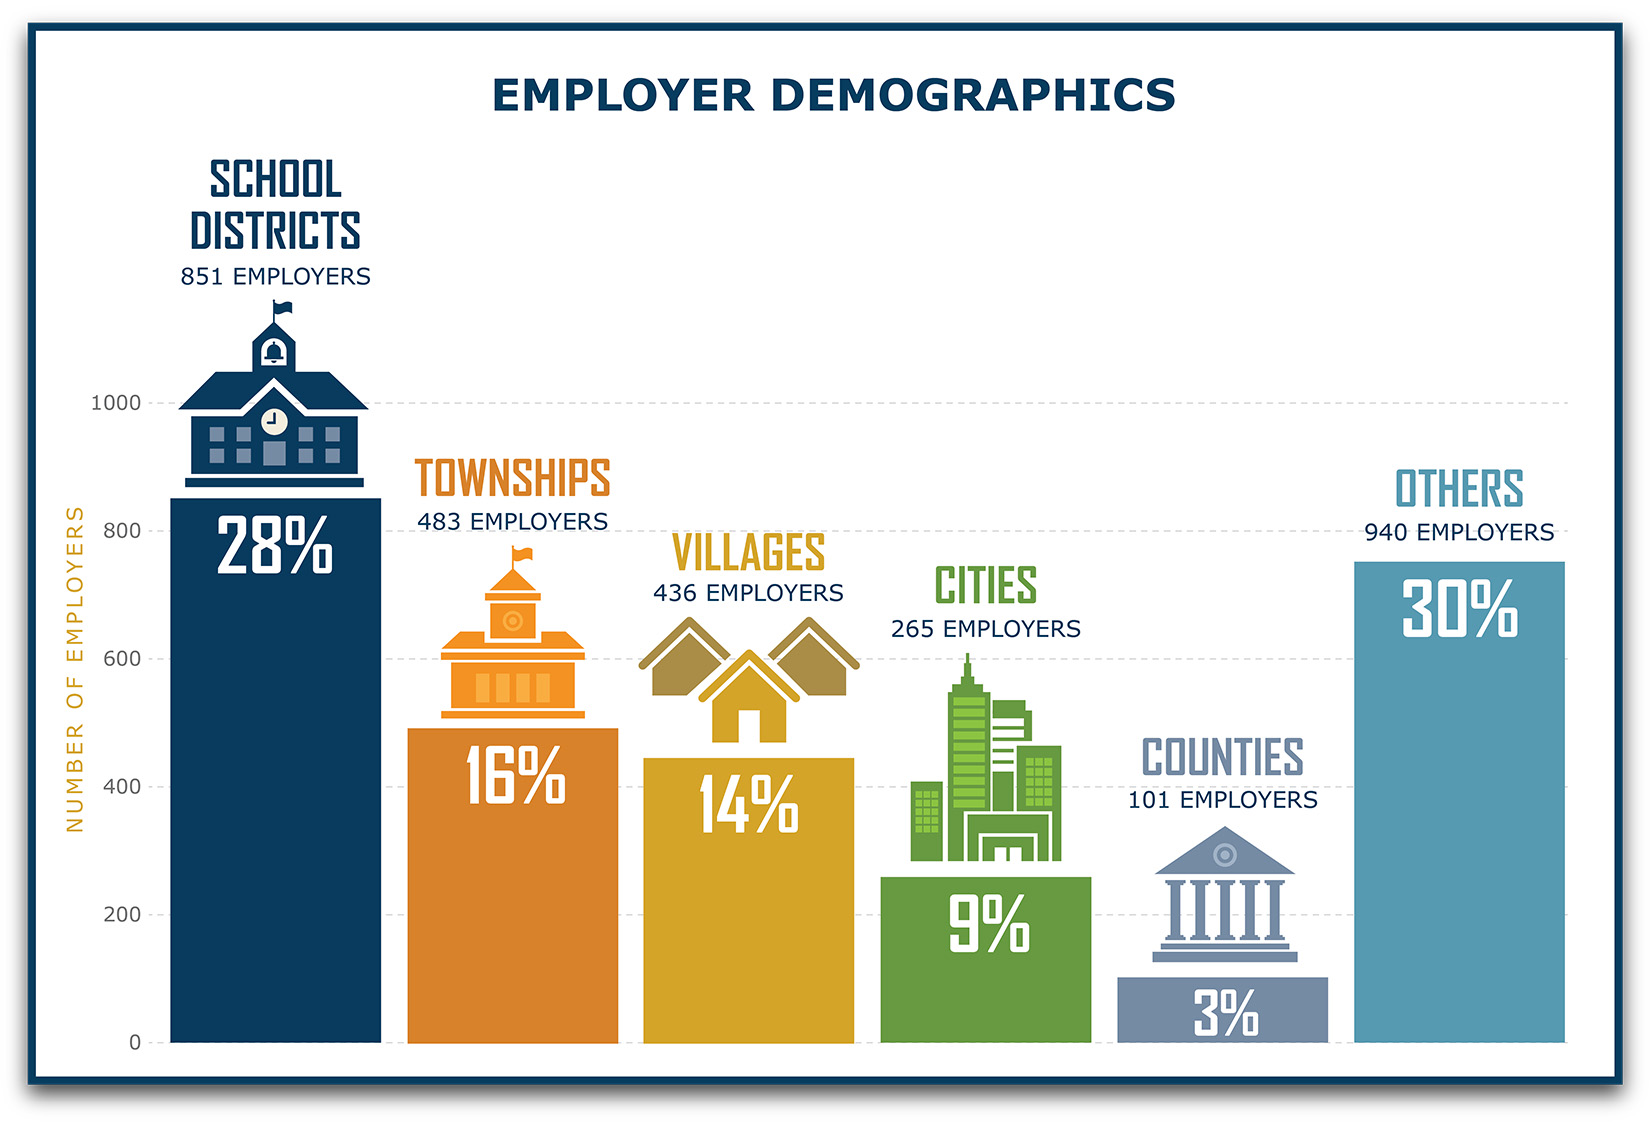
The Illinois Pension Code specifies the units of government required to participate in IMRF and those that may elect to join. In 2025, 3,076 units of government (employers) participated in IMRF, compared to 2,987 in 2016.
| Calendar Year End | Cities | Villages | Counties | School Districts | Townships | Other | Total |
|---|---|---|---|---|---|---|---|
| 2025 | 265 | 436 | 101 | 851 | 483 | 940 | 3,076 |
| 2016 | 259 | 417 | 101 | 851 | 488 | 871 | 2,987 |
 At IMRF, we REAACH for our goals
IMRF's values guide us to reach our mission, vision, and goals. They define how we work and shape the expectations we have for our organization. Through our commitment to these values, our members, employers, and stakeholders across Illinois and beyond can feel confident in IMRF as a world-class pension provider.

 IMRF Board of Trustees
Responsible for the prudent management of IMRF’s retirement assets, our eight-member Board of Trustees includes:
- Four Executive Trustees elected by participating units of government
- Three Employee Trustees elected by participating IMRF members
- One Annuitant Trustee elected by IMRF annuitants
- The Government Finance Officers Association (GFOA) awarded IMRF its prestigious "Triple Crown" Award for receiving all three GFOA Certificates of Achievement for Excellence in Financial Reporting for the Annual Comprehensive Financial Report (ACFR), Popular Annual Financial Report (PAFR), and Budget.
- Gwen Henry, who has served as Trustee since 2009, was re-elected to a 2-year term as Executive Trustee in December 2025. Her term will run through 2027.
- Peter Stefan, who has served as Trustee since 2021, was re-elected to a 3-year term as Executive Trustee in December 2025. His term will run through 2028.
- Brian Townsend, who has served as Executive Trustee during 2025, was re-elected to a 5-year term as Executive Trustee in December 2025. His term will run through 2030.
- Jason Issac, who has served as Employee Trustee during 2025, was re-elected to a 5-year term as Employer Trustee in December 2025. His term will run through 2030.
- Douglas Cycholl, who has served as Employee Trustee since 2024, was re-elected to a 5-year term as Employee Trustee in December 2025. His term will run through 2030.
- Thomas Kuehne, who previously served as Executive Trustee from 2013 through February 2025, was elected to a five-year term as Annuitant Trustee. His term will run through 2030.
- Two bills and One Federal Law that affect IMRF passed the General Assembly in 2025:Public Act 104-0284 makes three changes to the Pension Code. It requires the employer repayment period for accelerated payment charges to be increased from three years to seven years effective from August 15, 2025. It opens a window from January 1, 2026 to June 30, 2026 to allow the Sheriff ’s Law Enforcement Plan (SLEP) members to transfer Article 3 service to IMRF, with no limit on the amount of service that can be transferred effective January 1, 2026. It allows elected officials to be considered to have opted in to participation without a separate election if the member participated with that same employer in a non-elected position, the employer continued to report the member and make member and employer contributions in the new position and there was no gap in service between the two positions. Public Act 104-0631 allows SLEP retirees to return to work for up to 1,000 hours as a school security guard regardless of the hourly standard of the annuitant or employer. Effective August 15, 2025.
- IMRF moved the data center to its new location at 800 Commerce Drive in Oak Brook.
- IMRF upgraded its technology platform to the latest version of the product.
- IMRF adopted a new Strategic Plan for 2026-2028 with a focus on financial health, customer engagement, workforce engagement and operational excellence.
 2025 Pension Dollar
Pensions are a shared responsibility. Every dollar paid to IMRF retirees comes from three sources: investment earnings, employers, and members.