
IMRF invites you to read our 2018 Popular Annual Financial Report (PAFR). Derived from IMRF’s 2018 Comprehensive Annual Financial Report, the PAFR shares a summary of our financial condition, highlighting key insights in five sections. Click the links below to navigate to each section of our 2018 PAFR.
Fiduciary Net Position
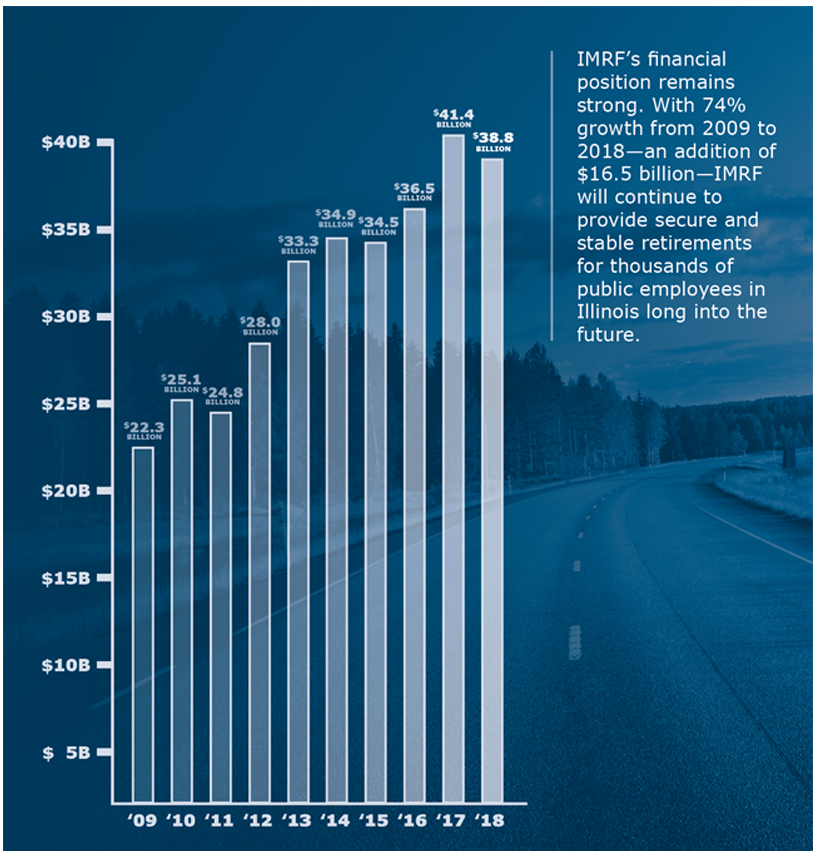
IMRF's fiduciary net position—total assets and deferred outflow of resources minus liabilities and deferred inflow of resources—was $38.8 billion as of December 31, 2018. This was a decrease of $2.6 billion, or about 6.3%, from 2017. The decrease reflects the decline in investment returns in 2018.
Over the last 10 years, IMRF’s fiduciary net position has grown 74% - an addition of $16.5 billion.
Funding Status
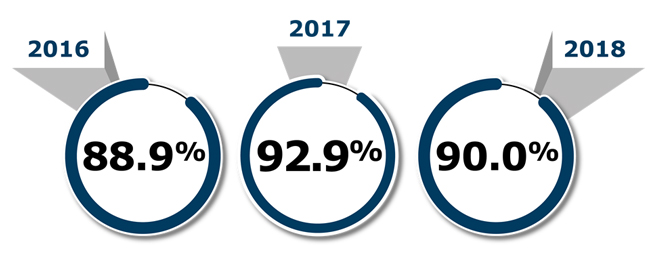
IMRF’s funding status is a key indicator of our overall financial health. It reflects the percentage of benefit promises that IMRF has assets to pay. IMRF strives toward 100% funding because it guarantees that the system can meet its obligations and is most cost effective for taxpayers.
As of December 31, 2018, IMRF was 90% funded on an actuarial basis. IMRF’s actuarial funding status is determined by independent actuaries using a “smoothing” technique that recognizes investment gains and losses over a five year period. The actuarial funding status is used to set IMRF contribution rates for participating units of government.
Investments
IMRF’s investment portfolio was valued at $38.5 billion on December 31, 2018.
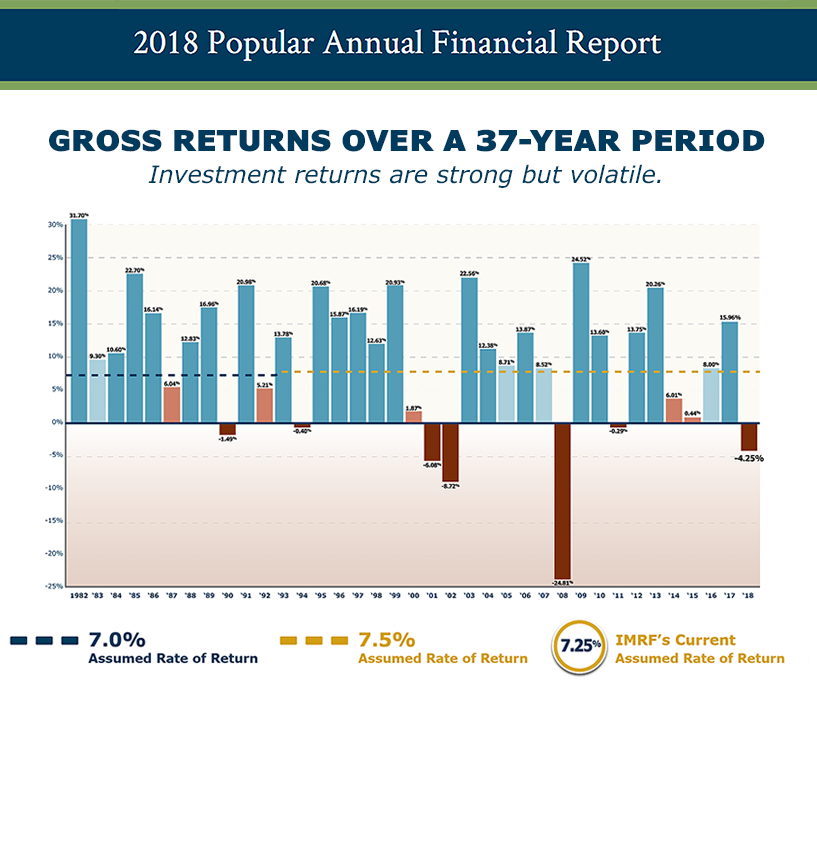
The portfolio lost 4.41% after investment management fees during 2018, decreasing the value of the portfolio by $2.7 billion from December 31, 2017.
Investors’ appetite for risk, while elevated for much of 2018, evaporated as the year drew to a close and wiped out positive returns for the year across many broad assets classes.
IMRF’s domestic equity portfolio lost 6.3% after fees while the international equity portfolio lost 14.4% after fees in 2018. Conversely, IMRF’s real estate portfolio returned 8.4% after fees and the alternative investments portfolio returned 17.1% after fees in 2018.
IMRF’s long-term goal is to earn an annualized total fund return greater than the assumed rate of return, after investment management fees. While IMRF did not achieve this goal in 2018, IMRF does achieve its investment return goal over longer time horizons.
2018 Target vs. Actual Asset Allocation
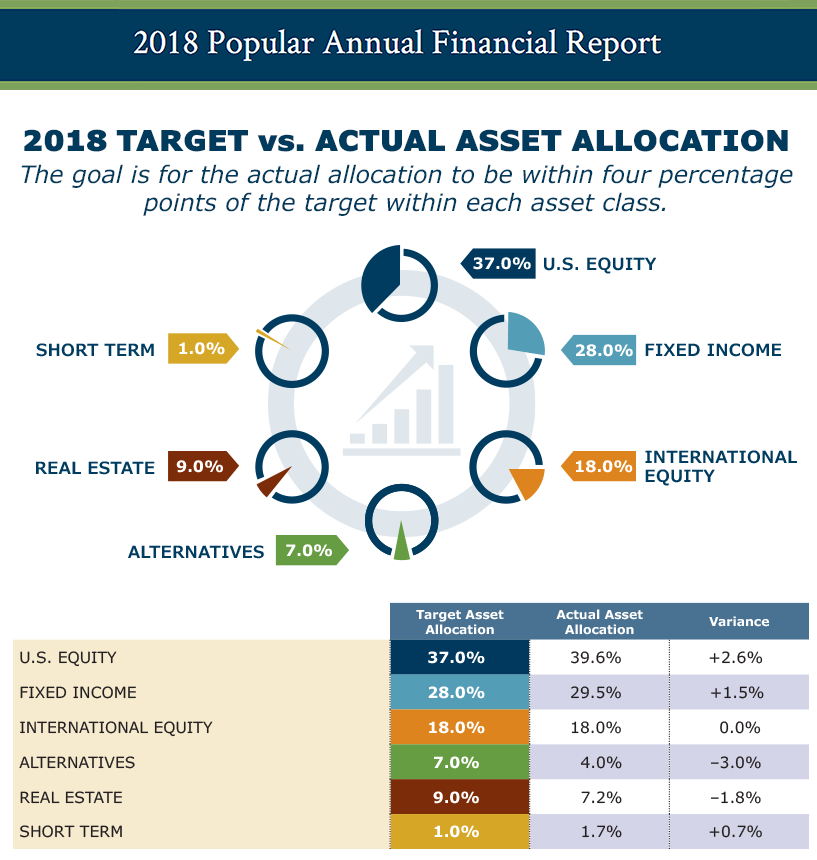
The IMRF Board of Trustees maintained the same target asset allocation for the IMRF investment portfolio in 2018 as for 2017. The target allocation has two key goals: maximize return and minimize risk. The Board continually evaluates the portfolio’s target asset allocation and makes adjustments as necessary.
As the value of the assets fluctuates, the portfolio’s actual allocation always varies from the target. The goal is for the actual allocation to be within 4% of the target within each asset class.
On December 31, 2018, the portfolio’s actual allocation was within the prescribed range for all but one asset class.
Revenue and Expenses
Revenue
IMRF’s revenue comes from member contributions, contributions from participating units of government (employers), and investment income. In 2018, IMRF’s total revenue was negative about $386 million. The negative revenue reflects the investment loss of 4.41% in 2018.
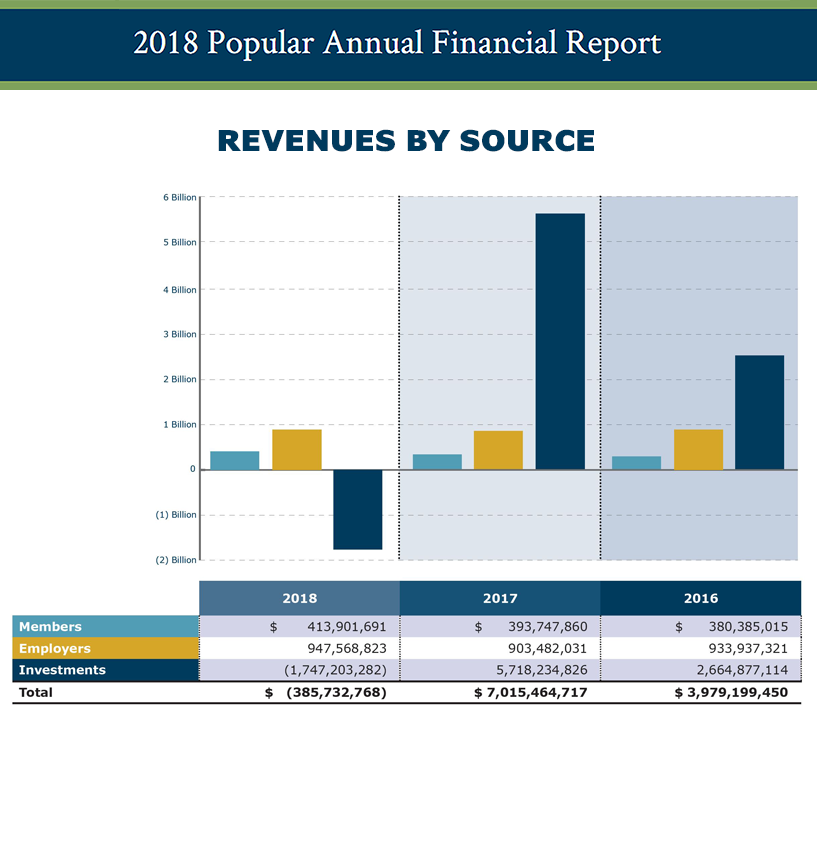
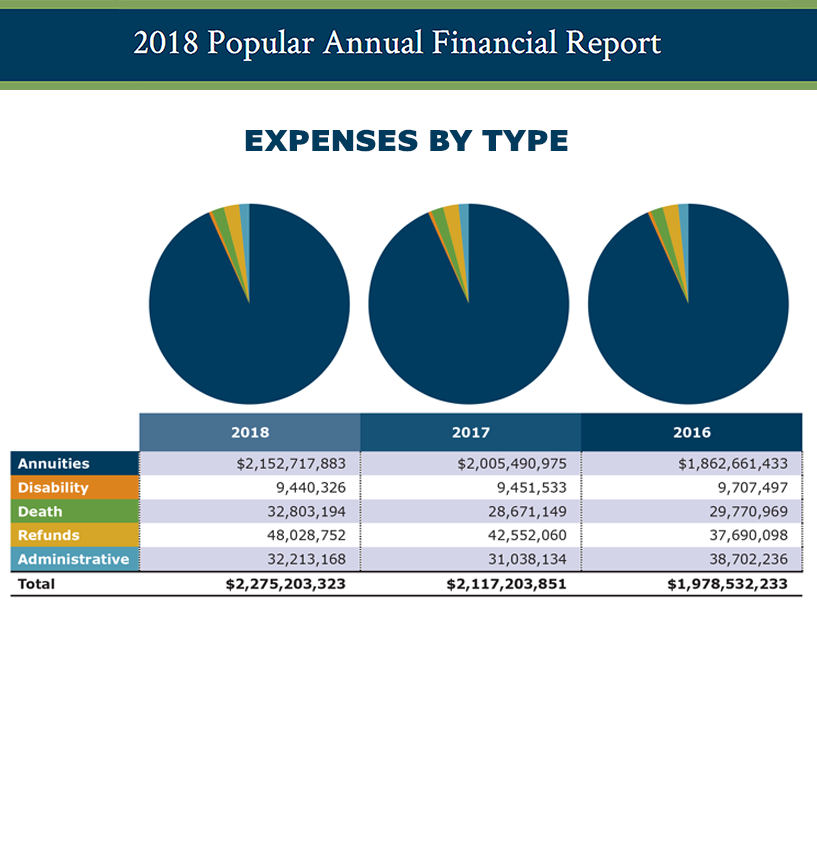
Expenses
IMRF’s expenses include annuities (pension payments), disability and death benefits, refunds to members, and the cost to administer IMRF’s benefit system. In 2018, IMRF’s total expenses equaled about $2.3 billion.
Total pension payments increased by about $147 million from 2017 to 2018, or about 7.3%.
Members and Employers
IMRF experienced growth in both members and employers in 2018.
Members
Members increased by 4.6% over the last three years to a total of 429,717 active members, inactive members, and retirees in 2018.
| Members | 2018 | 2017 | 2016 |
|---|---|---|---|
| Active | 176,517 | 175,565 | 175,019 |
| Inactive | 119,939 | 115,970 | 112,604 |
| Retirees | 133,261 | 128,264 | 123,206 |
| Grand Total | 429,717 | 419,799 | 410,829 |
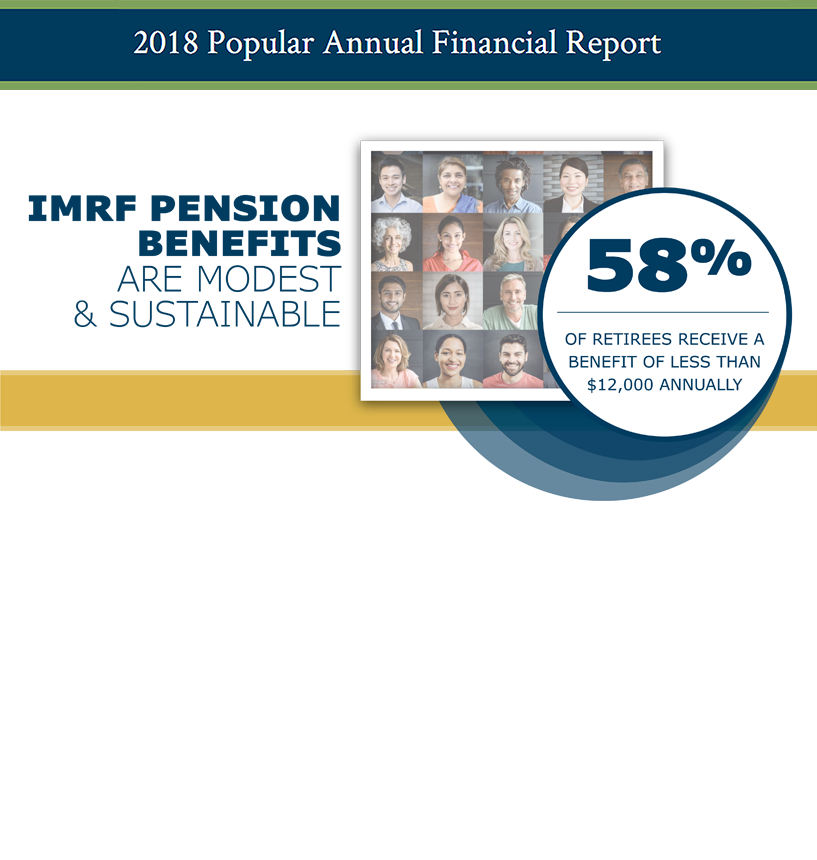
The typical IMRF retiree receives a modest benefit, earned after decades of public service. In 2018, out of IMRF’s 133,261 retirees, less than 2% of retirees receive $72,000 or more annually.
Distribution of Annuitants by Pension Amount
| Annual Pension Amount | Annuitants |
|---|---|
| Under $1,200 | 6,539 |
| $1,200 to under $3,000 | 15,416 |
| $3,000 to under $6,000 | 24,374 |
| $6,000 to under $9,000 | 17,978 |
| $9,000 to under $12,000 | 13,031 |
| $12,000 to under $24,000 | 28,493 |
| $24,000 to under $36,000 | 12,593 |
| $36,000 to under $48,000 | 6,484 |
| $48,000 to under $60,000 | 3,615 |
| $60,000 to under $72,000 | 2,098 |
| $72,000 and over | 2,640 |
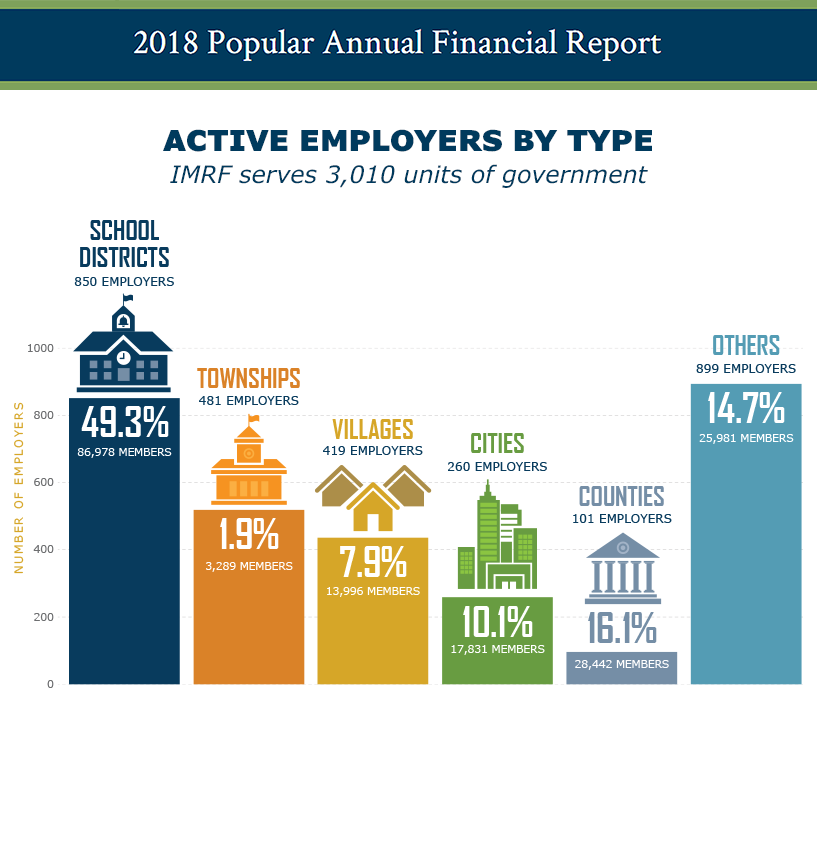
Employers
The Illinois Pension Code specifies the units of government required to participate in IMRF and those that may elect to join. In 2018, 3,010 units of government (employers) participated in IMRF, compared to 2,950 in 2009.
| Calendar Year End | Cities | Villages | Counties | School Districts | Townships | Other | Total |
|---|---|---|---|---|---|---|---|
| 2018 | 260 | 419 | 101 | 850 | 481 | 899 | 3,010 |
| 2009 | 256 | 407 | 101 | 865 | 477 | 844 | 2,950 |
 At IMRF, we REAACH for our goals
IMRF's values guide us to reach our mission, vision, and goals. They define how we work and shape the expectations we have for our organization. Through our commitment to these values, our members, employers, and stakeholders across Illinois and beyond can feel confident in IMRF as a world-class pension provider.

 IMRF Board of Trustees
Responsible for the prudent management of IMRF’s retirement assets, our eight-member Board of Trustees includes:
- Four Executive Trustees elected by participating units of government
- Three Employee Trustees elected by participating IMRF members
- One Annuitant Trustee elected by IMRF annuitants
- IMRF welcomed new Executive Director Brian Collins on January 8. Collins joined IMRF after serving as CFO for the City of Memphis. Read the announcement.
- Sue Stanish was elected to her second term as Executive Trustee on IMRF’s Board of Trustees. Read more about the election.
- IMRF reduced its assumed rate of return from 7.5% net of fees to 7.25% net of fees at the recommendation of actuarial consultant GRS Retirement Consulting. The new assumed rate of return was effective January 1, 2019. Read more about the effects of this change on members and employers.
- Three bills that affect IMRF passed the Illinois General Assembly in 2018: Public Act 100-1097, Public Act 100-0935, and Public Act 100-0902. Read more about these bills.
- IMRF continued progress on a multi-year effort to update its technology platform. The project is expected to be completed in 2021.
 2018 Pension Dollar
Pensions are a shared responsibility. Every dollar paid to IMRF retirees comes from three sources: investment earnings, employers, and members.