
IMRF invites you to read our 2019 Popular Annual Financial Report (PAFR). Derived from IMRF’s 2019 Comprehensive Annual Financial Report, the PAFR shares a summary of our financial condition, highlighting key insights in five sections. Click the links below to navigate to each section of our 2019 PAFR.
Fiduciary Net Position
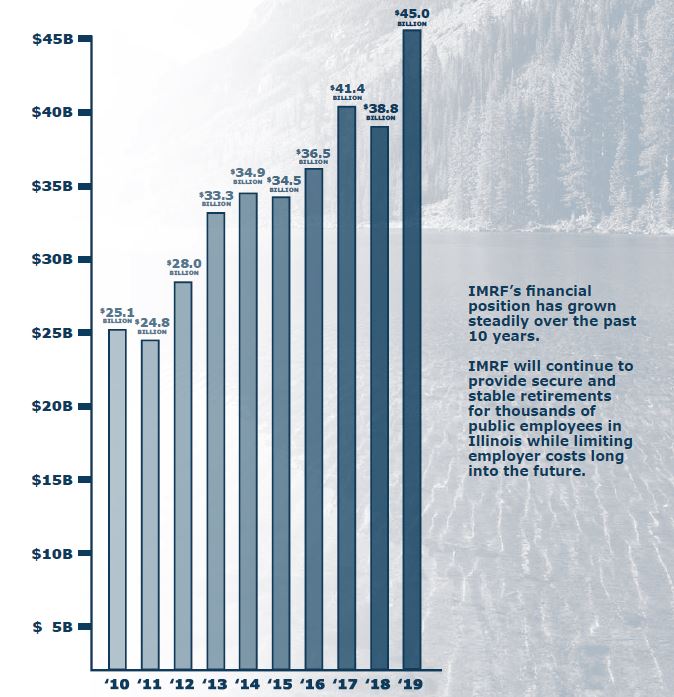
IMRF's fiduciary net position—total assets and deferred outflow of resources minus liabilities and deferred inflow of resources—was $45.0 billion as of December 31, 2019. That was an increase of $6.2 billion, or about 15.9%, from 2018. The increase is attributable to strong 2019 investment returns. The 2019 financial markets strongly rebounded from the losses in 2018, driven largely by gains in the technology sector and a lowering of interest rates from the Federal Reserve.
Over the last 10 years, IMRF’s fiduciary net position has grown 79% - an addition of $19.9 billion.
Funding Status
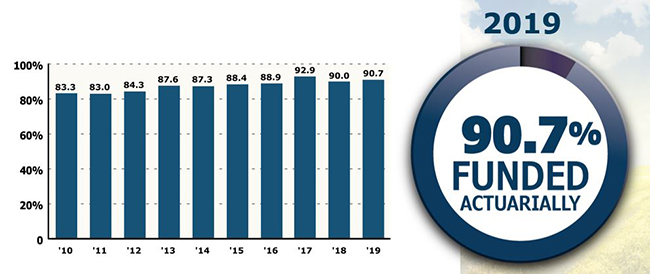
IMRF's funding status is a key indicator of our overall financial health. It reflects the percentage of benefit promises that IMRF has assets to pay. IMRF strives toward 100% funding because it guarantees that the system can meet its obligations and is most cost effective for taxpayers.
As of December 31, 2019, IMRF was 90.7% funded on an actuarial basis. IMRF's actuarial funding status is determined by independent actuaries using a "smoothing" technique that recognizes investment gains and losses over a five-year period. The actuarial funding status is used to set IMRF contribution rates for participating units of government. Below you will see that over the last 10 years IMRF's funded status has held strong above 85% dating back to 2013.
Investments
IMRF’s investment portfolio was valued at $44.8 billion on December 31, 2019.
The portfolio returned 19.6% after investment management fees during 2019. This return increased the value of the portfolio by $6.2 billion from December 31, 2018.
Global stocks marched steadily upward in 2019. Investor confidence in continued global economic growth helped all major asset classes post positive returns.
IMRF’s U.S. Stock portfolio performed particularly well during 2019 recording 29% return. The international stock portfolio returned 23.4% compared to 21.5% for IMRF's benchmark.
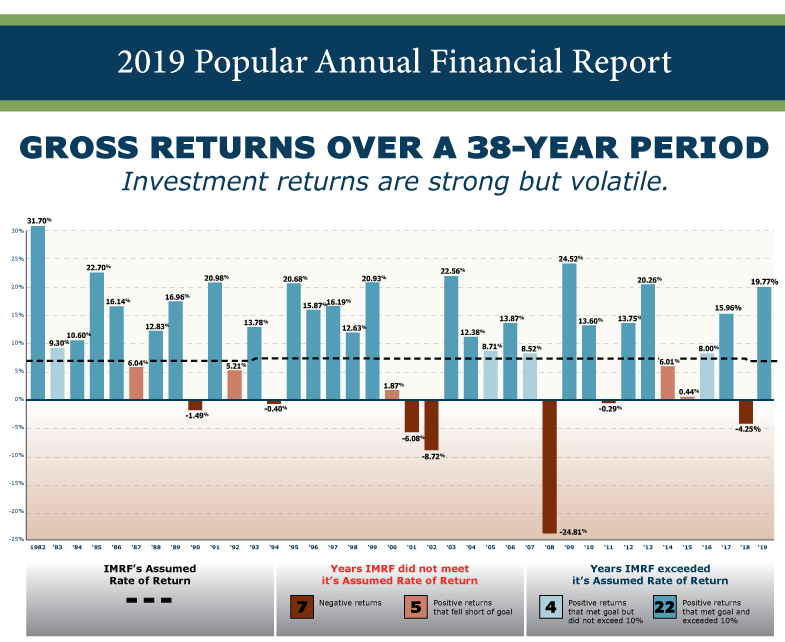
IMRF’s current long-term goal is to earn an annualized total fund return of 7.25%, after investment-management fees. With a return of 19.6% in 2019, IMRF achieved its goal. IMRF has also achieved its investment return goal over longer time horizons. For example, over the last 5 years, IMRF has earned 7.6% after paying investment-management fees. The bar chart below shows IMRF’s returns over the past 38 years compared to our assumed rate of return.
2019 Target vs. Actual Asset Allocation
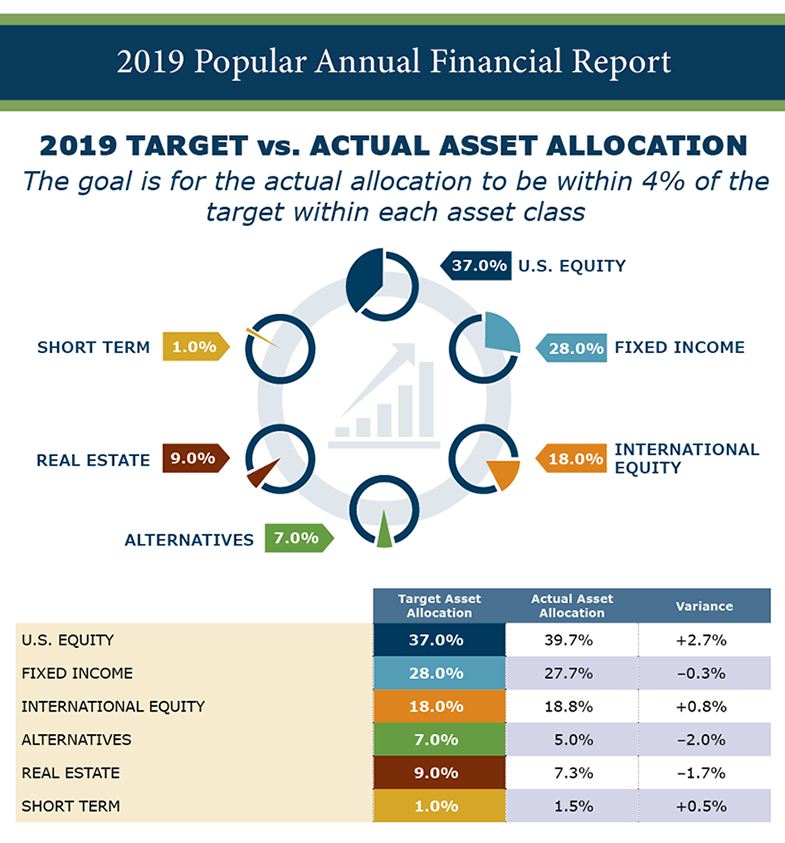
The IMRF Board of Trustees maintained the same target asset allocation for the IMRF investment portfolio in 2019 as for 2018. The target allocation has two key goals: maximize return and minimize risk. The Board continually evaluates the portfolio’s target asset allocation and makes adjustments as necessary.
As the value of the assets fluctuates, the portfolio’s actual allocation always varies from the target. The goal is for the actual allocation to be within 4% of the target within each asset class.
On December 31, 2019, the portfolio’s actual allocation was within the prescribed range for all asset classes.
Revenue and Expenses
Revenue
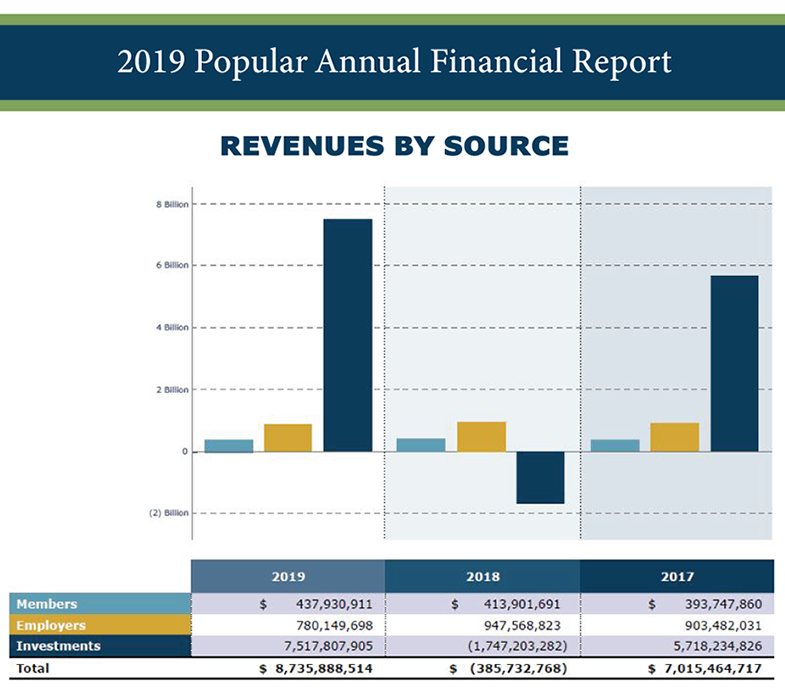
IMRF’s revenue comes from member contributions, contributions from participating units of government (also called IMRF employers), and investment income. IMRF’s total revenue during 2019 was $8.7 billion.
About 98% of IMRF members participate in the Regular Plan. These members pay 4.5% out of every paycheck to fund IMRF benefits. Total member contributions were almost $438 million in 2019.
All IMRF employers also make monthly payments to support the IMRF benefit system. Each IMRF employer pays an amount calculated by IMRF based on its IMRF assets, liabilities, and the demographics of its workforce. Total employer contributions were about $780 million in 2019.
Member and employer contributions are invested. Historically, IMRF investments account for the majority of IMRF’s revenue. This was true in 2019, when IMRF investments generated $7.5 billion in revenue.
As you can see from the 3 year comparison below member and employer contributions remain stable while investment returns are strong but volatile.
Expenses
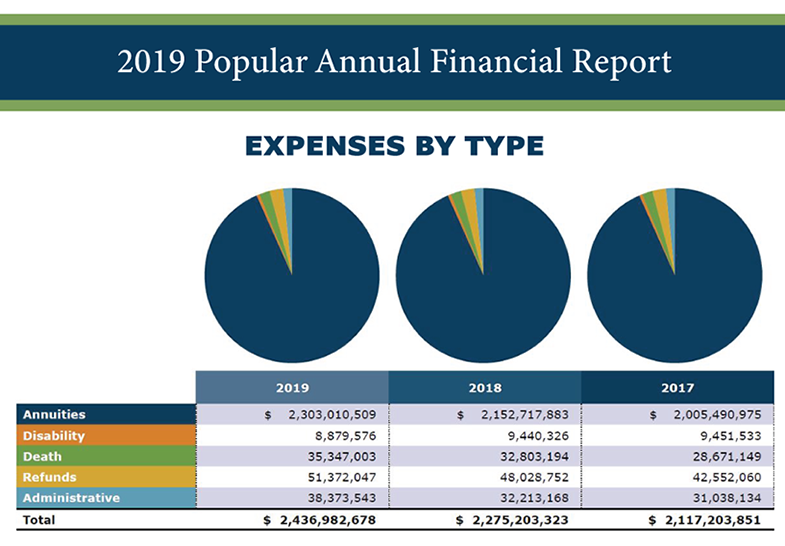
IMRF's expenses include annuities (pension payments), disability and death benefits, refunds to members, and the cost to administer IMRF’s benefit system. In 2019, IMRF’s total expenses equaled about $2.4 billion.
Total pension payments increased by about $161 million from 2018 to 2019, or about 7.1%.
Members and Employers
IMRF experienced growth in both members and employers in 2019.
Members
Members increased by 4.9% over the last three years to a total of 440,068 active members, inactive members, and retirees in 2019.
| Members | 2019 | 2018 | 2017 |
|---|---|---|---|
| Active | 177,809 | 176,517 | 175,565 |
| Inactive | 124,170 | 119,939 | 115,970 |
| Retirees | 138,089 | 133,261 | 128,264 |
| Grand Total | 440,068 | 429,717 | 419,799 |
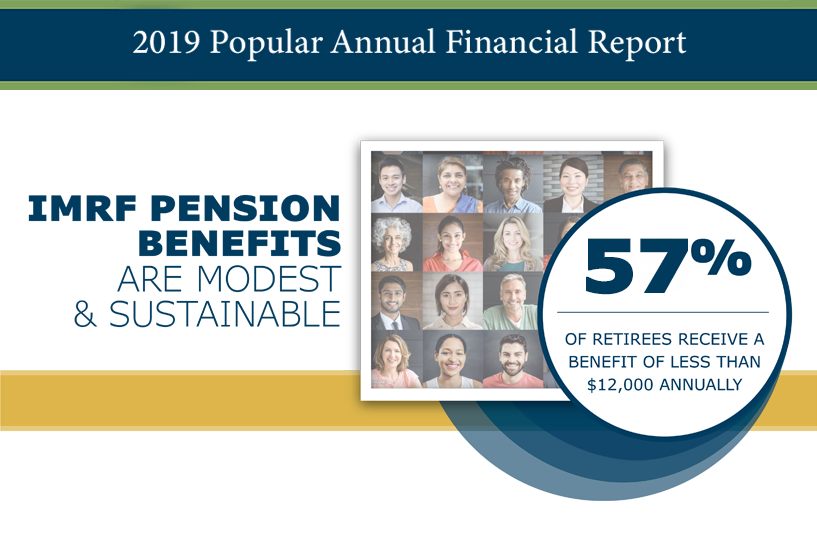
The typical IMRF retiree receives a modest benefit, earned after decades of public service. In 2019, out of IMRF’s 138,089 retirees, less than 2.2% of retirees receive $72,000 or more annually.
Distribution of Annuitants by Pension Amount
| Annual Pension Amount | Annuitants |
|---|---|
| Under $1,200 | 6,370 |
| $1,200 to under $3,000 | 15,192 |
| $3,000 to under $6,000 | 24,414 |
| $6,000 to under $9,000 | 18,412 |
| $9,000 to under $12,000 | 13,448 |
| $12,000 to under $24,000 | 29,902 |
| $24,000 to under $36,000 | 13,351 |
| $36,000 to under $48,000 | 6,966 |
| $48,000 to under $60,000 | 3,947 |
| $60,000 to under $72,000 | 2,295 |
| $72,000 and over | 2,992 |
Employers
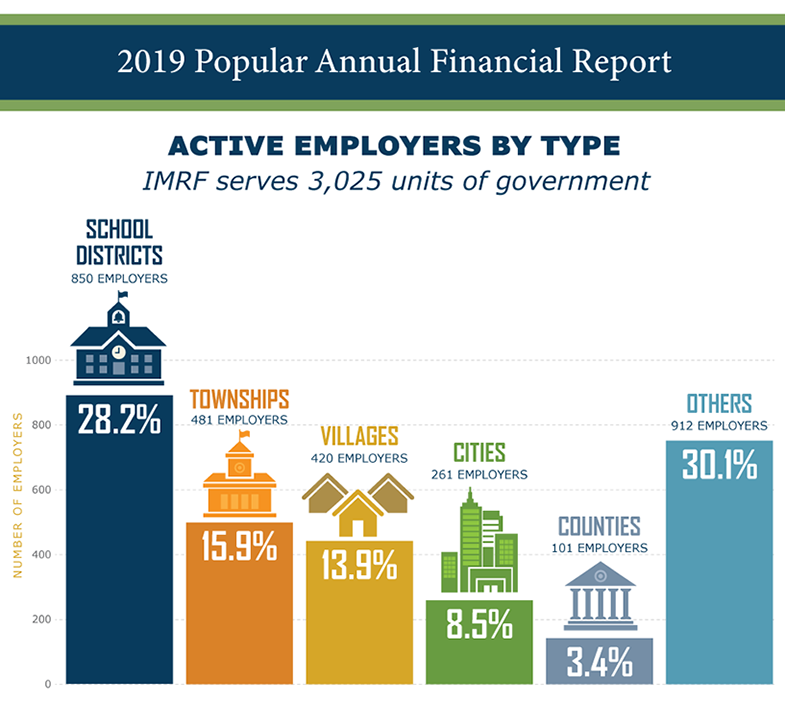
The Illinois Pension Code specifies the units of government required to participate in IMRF and those that may elect to join. In 2019, 3,025 units of government (employers) participated in IMRF, compared to 2,963 in 2010.
| Calendar Year End | Cities | Villages | Counties | School Districts | Townships | Other | Total |
|---|---|---|---|---|---|---|---|
| 2019 | 261 | 420 | 101 | 850 | 481 | 912 | 3,025 |
| 2010 | 257 | 410 | 101 | 864 | 477 | 854 | 2,963 |
 At IMRF, we REAACH for our goals
IMRF's values guide us to reach our mission, vision, and goals. They define how we work and shape the expectations we have for our organization. Through our commitment to these values, our members, employers, and stakeholders across Illinois and beyond can feel confident in IMRF as a world-class pension provider.
 IMRF Board of Trustees
Responsible for the prudent management of IMRF’s retirement assets, our eight-member Board of Trustees includes:
- Four Executive Trustees elected by participating units of government
- Three Employee Trustees elected by participating IMRF members
- One Annuitant Trustee elected by IMRF annuitants
- Sadly, Annuitant Trustee Sharon U. Thompson passed suddenly on October 3, 2019. Ms. Thompson’s term is being filled by William Stafford. The IMRF board appointed Stafford to complete Thompson’s term, which runs through December 31, 2020. To learn more about Thompson’s legacy and contributions to IMRF, click here.
- Natalie Copper, a School-Age Child Care Site Coordinator at Evanston School District 65, ran unopposed and was re-elected to the Board as Employee Trustee. Her new term will run from January 1, 2020 through December 31, 2024. Copper has served on the Board since 2010.
- In November of 2019 IMRF received the "Malcolm Baldrige National Quality Award." This marked the first time a public pension fund received this prestigious award. To learn more about this momentous achievement and hear from Brian Collins, IMRF Executive Director, click this link.
- In March of 2019 IMRF won the "2019 Plan Sponsor of the Year Award" at PLANSPONSOR Magazine's Excellence in Retirement Awards ceremony in New York City. The magazine recognized IMRF as the top public defined benefit plan in the United States. To read more about this award and what it means for IMRF click here.
 2019 Pension Dollar
Pensions are a shared responsibility. Every dollar paid to IMRF retirees comes from three sources: investment earnings, employers, and members.