
IMRF invites you to read our 2024 Popular Annual Financial Report (PAFR). Derived from IMRF’s 2024 Annual Comprehensive Financial Report (ACFR), the PAFR is consistent with generally accepted accounting principles (GAAP) and shares a summary of our financial condition, highlighting key insights in five sections. Further details can be found in the ACFR. Click the links below to navigate to each section of our 2024 PAFR.
Investments
IMRF’s investment portfolio was valued at $55.2 billion on December 31, 2024.
The portfolio’s 2024 rate of return was 9.2% after investment management fees. This corresponds to investment gains of $5.1 billion.
The 2024 financial market was up compared to the 2023 market. The 2024 financial markets increased over 2023 markets impacted by lower inflation, the Federal Reserve’s rate cut, the U.S. Presidential election, near steady unemployment, job growth consistent throughout the year, a sluggish global economy, and stronger consumer spending. The Federal Reserve’s lowered interest rates to combat inflation appeared to work to tamp down inflation from almost 3.4% to 2.0% for the year.
In 2024, IMRF’s domestic equity portfolio increased 18.8% after fees, and the international equity portfolio increased 6.0% after fees. The fixed income portfolio increased 3.0% after fees. Conversely, IMRF’s real estate portfolio decreased (2.3)% after fees, and the alternative investments portfolio returned 6.8% after fees in 2024.
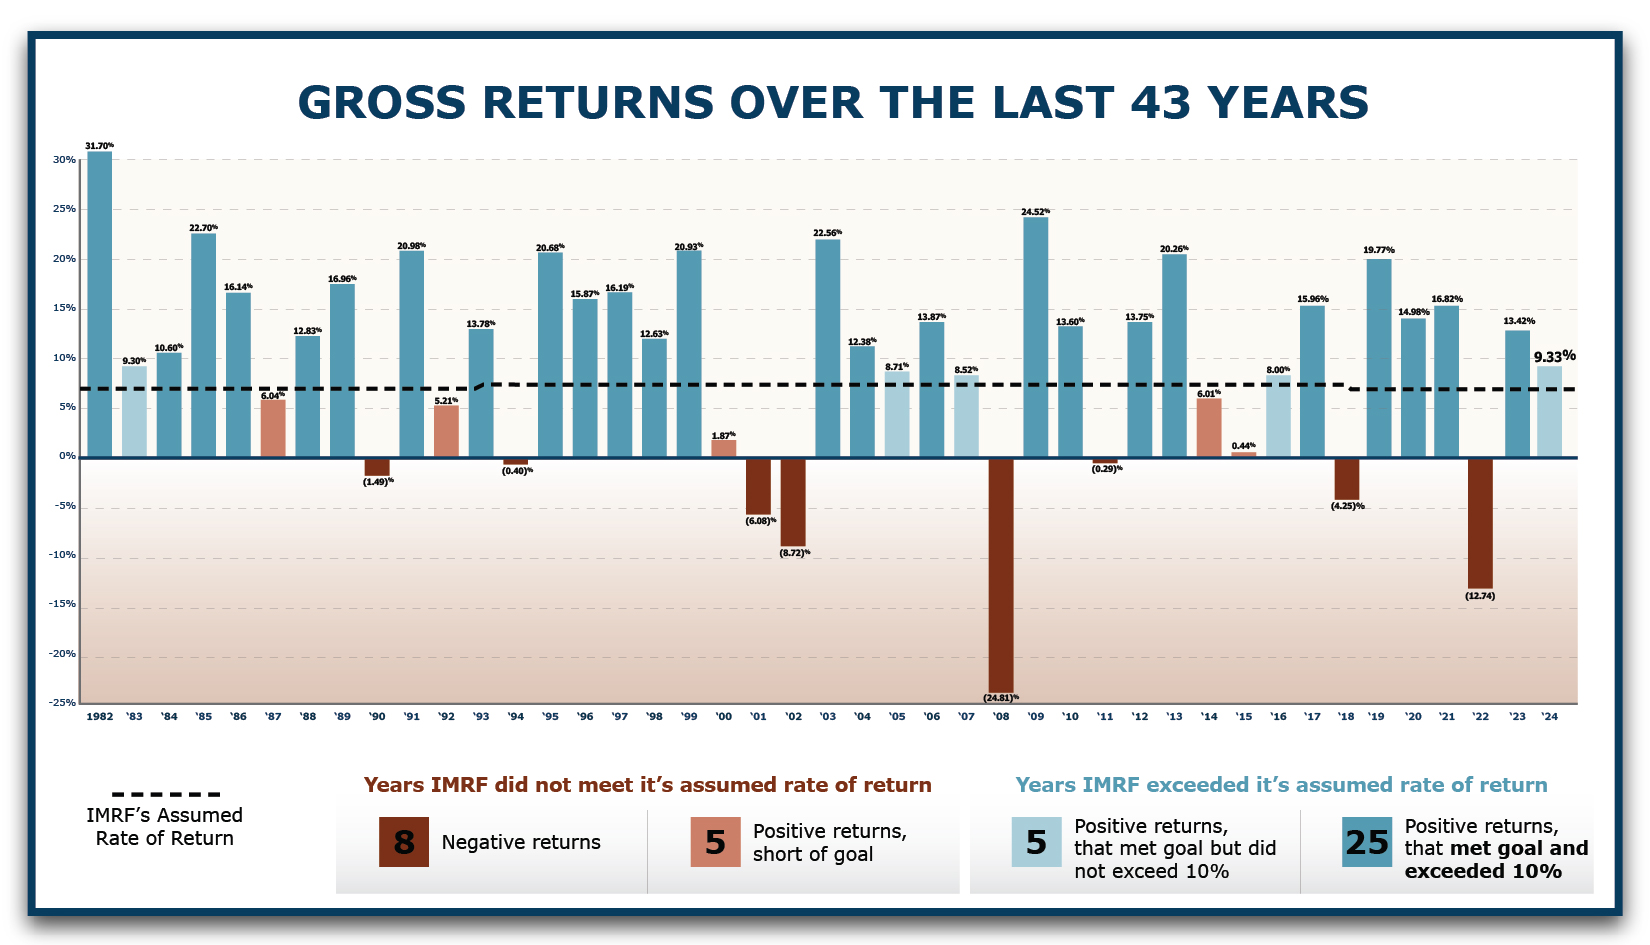
IMRF’s long-term goal is to earn an annualized total fund return of 7.25%, after investment management fees. IMRF achieved this goal in 2024 as well as over longer time horizons. The bar chart below shows IMRF’s returns over the past 43 years, compared to the 7.25% goal.
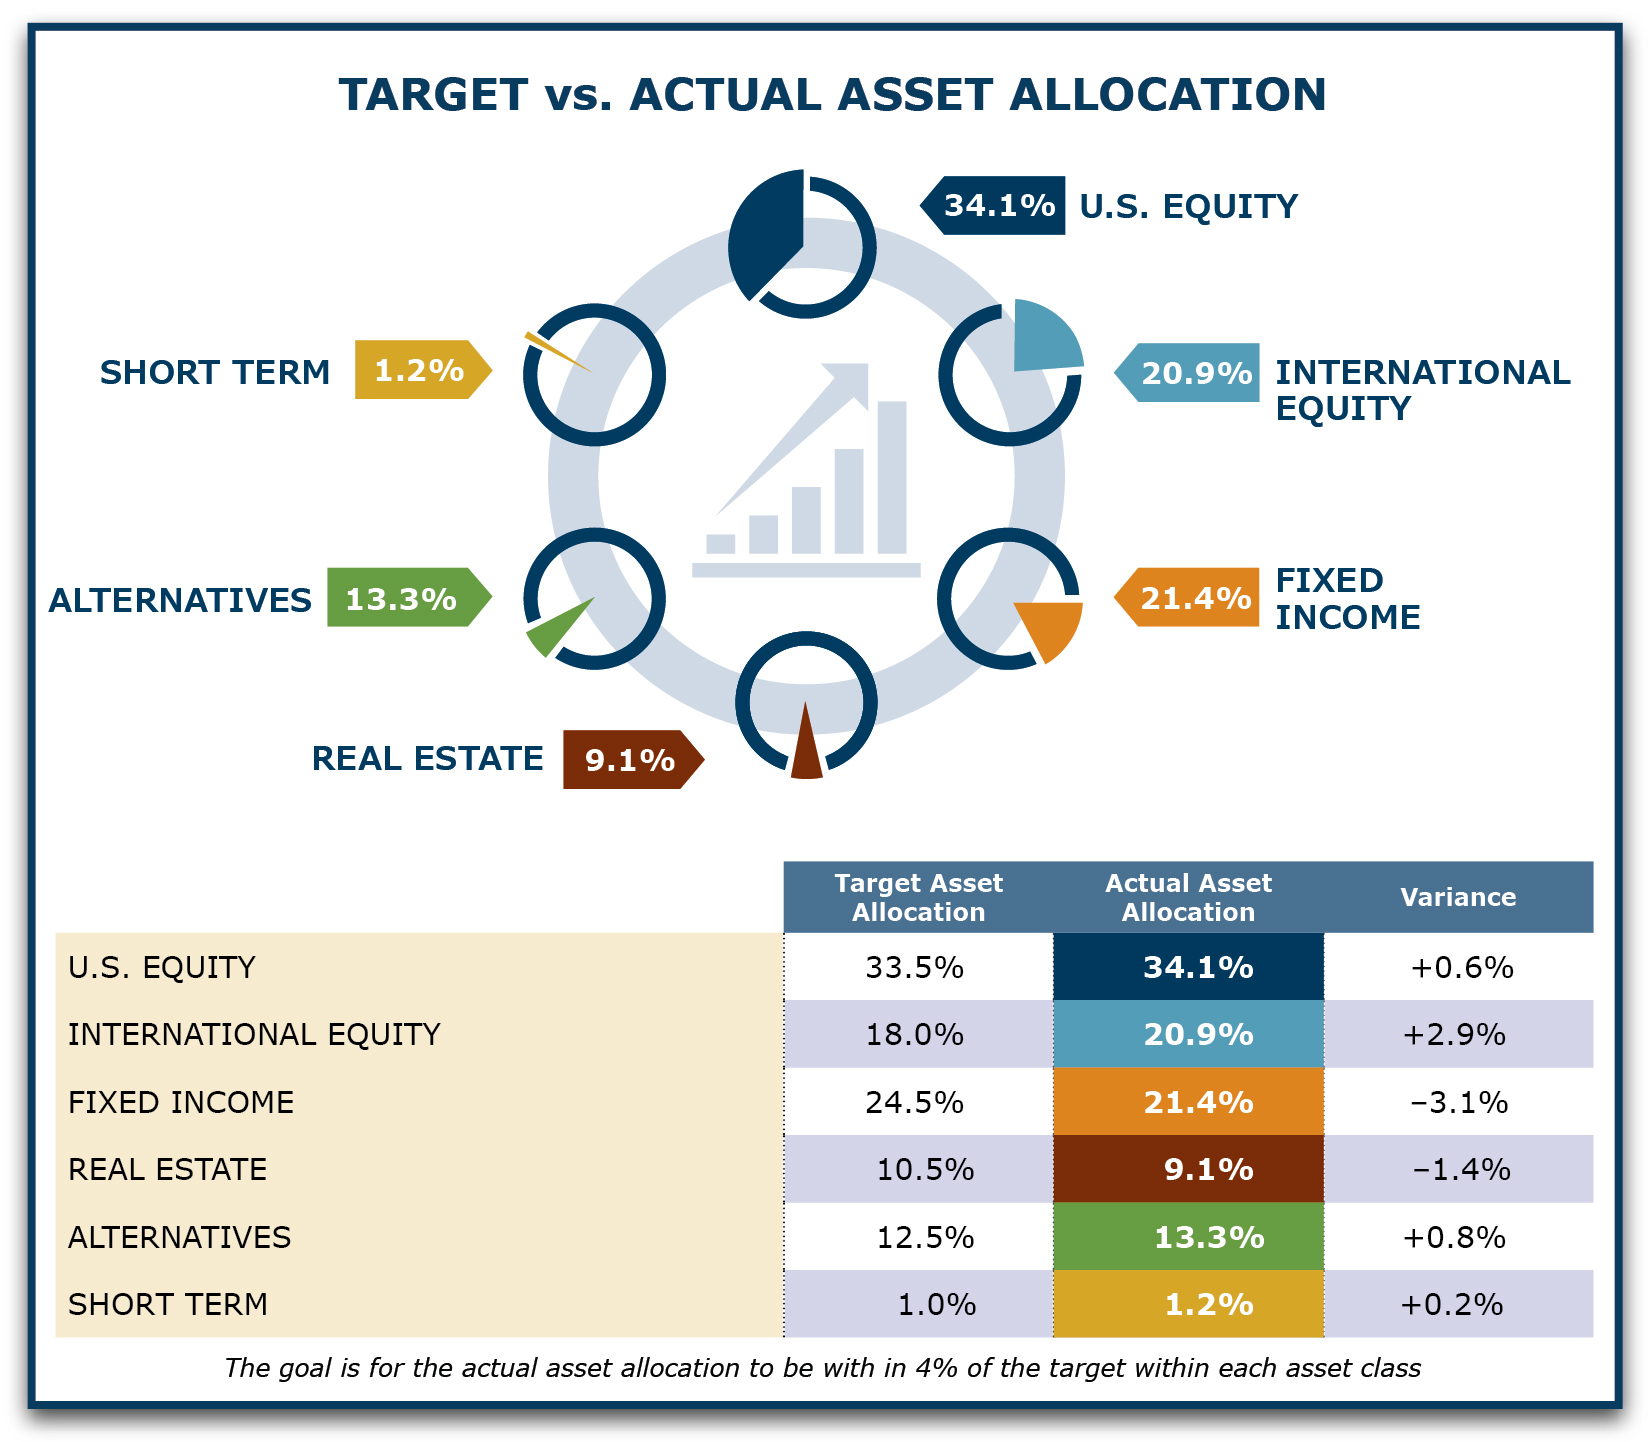
2024 Target vs. Actual Asset Allocation
The IMRF Board of Trustees revised the target asset allocation for the IMRF investment portfolio in 2024. The target allocation has two key goals: maximize return and minimize risk. The Board continually evaluates the portfolio’s target asset allocation and makes adjustments as necessary.
As the value of the assets fluctuates, the portfolio’s actual allocation always varies from the target. The goal is for the actual allocation to be within 4% of the target within each asset class.
On December 31, 2024, the portfolio’s actual allocation was within the prescribed range for all asset classes.
Funding Status
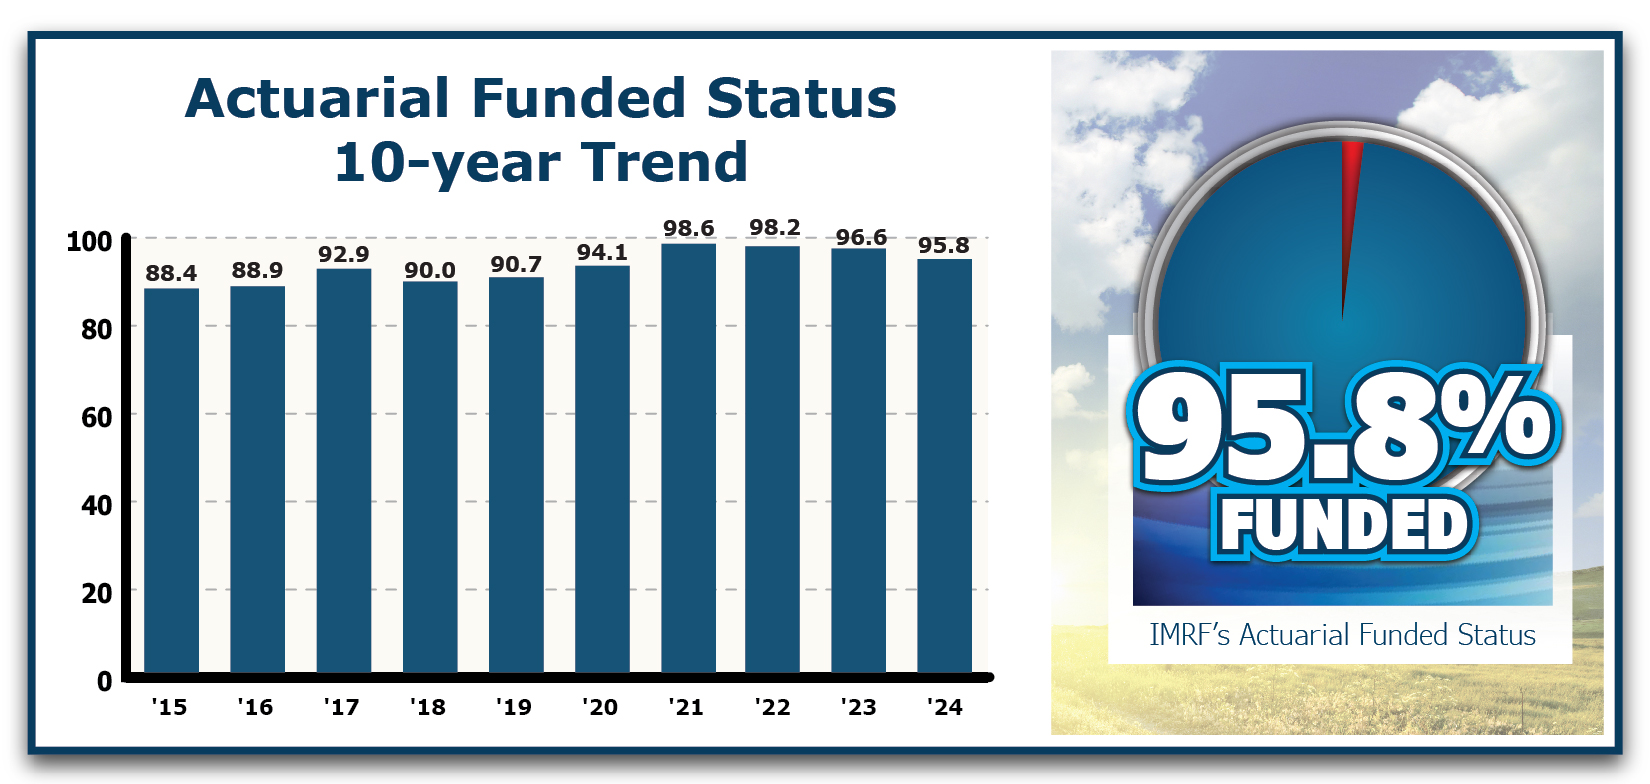
IMRF’s funding status is a key indicator of our overall financial health. It reflects the percentage of promised benefits that IMRF currently has the assets to pay. IMRF strives for 100% funding, because it guarantees that the system can meet its obligations and is most cost effective for taxpayers.
As of December 31, 2024, IMRF was 95.8% funded on an actuarial basis. IMRF's actuarial funding status is determined by independent actuaries using a "smoothing" technique that recognizes investment gains and losses over a five-year period. The actuarial funding status is used to set IMRF contribution rates for participating units of government. Below you will see, IMRF's funded status has remained above 88% since 2015.
Fiduciary Net Position
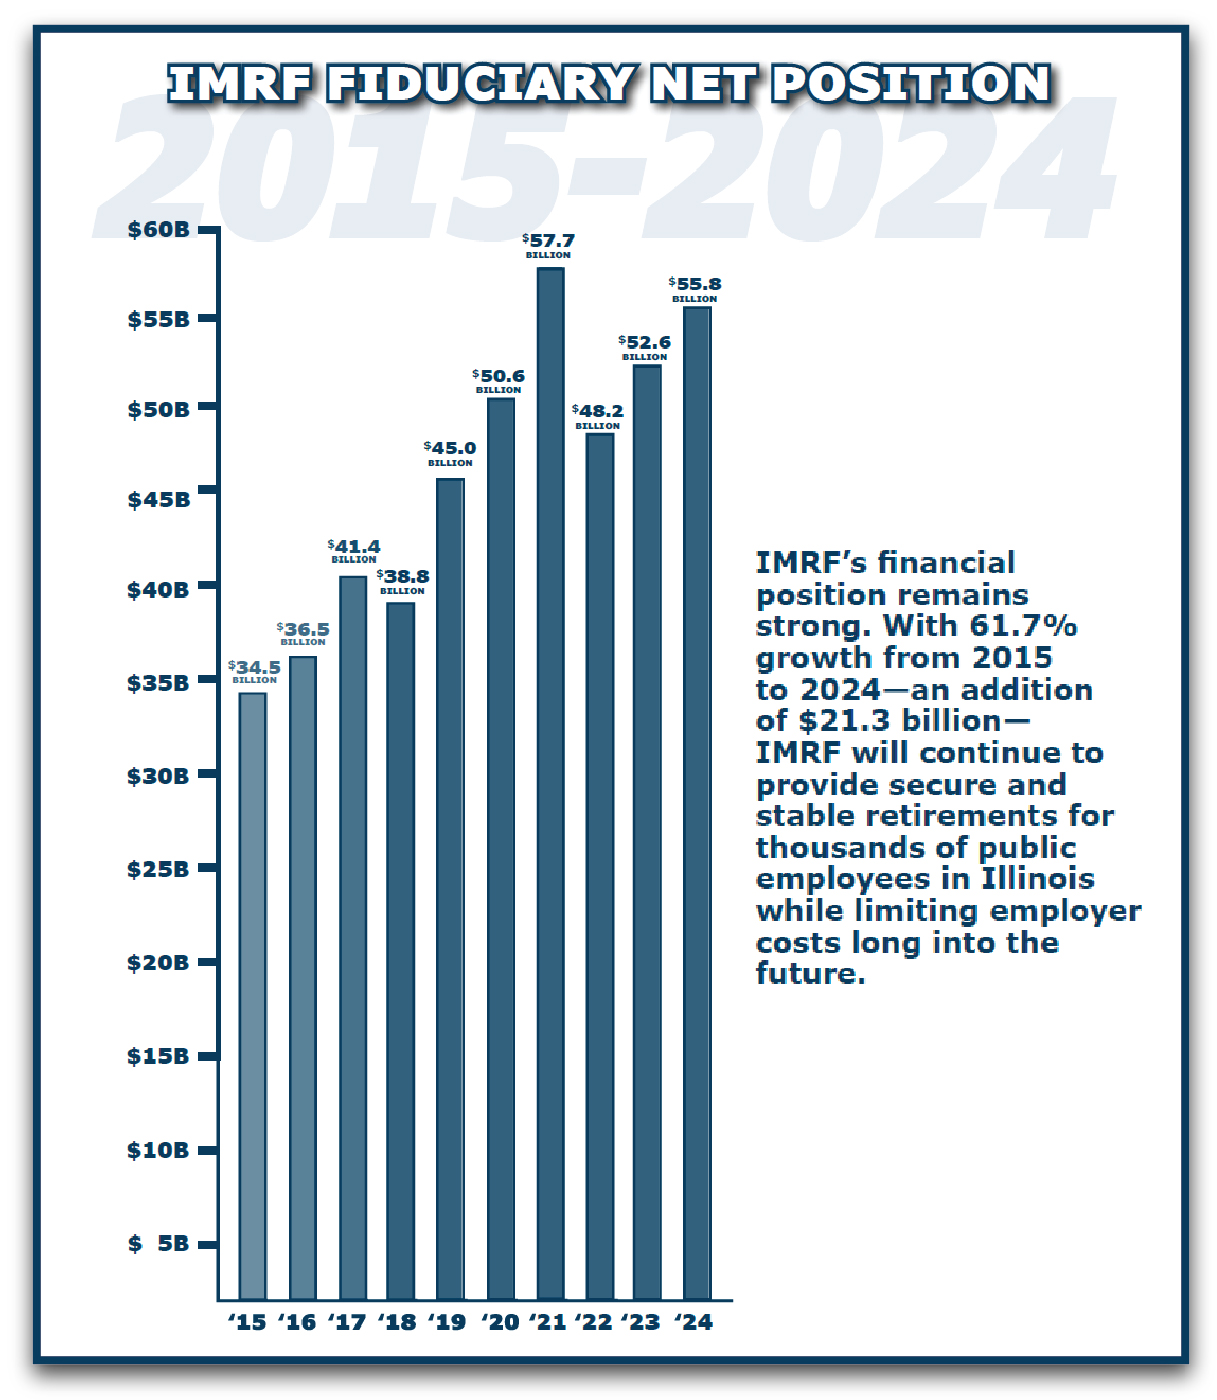
IMRF's fiduciary net position—total assets and deferred outflow of resources minus liabilities and deferred inflow of resources—was $55.8 billion as of December 31, 2024. That was an increase of $3.2 billion, or about 6.0%, from 2023. This increase reflects positive investment returns in 2024.
With positive gains in 2024, IMRF’s financial position remains strong. With 61.7% growth from 2015 - 2024, IMRF's long-term investment strategy withstands short-term losses.
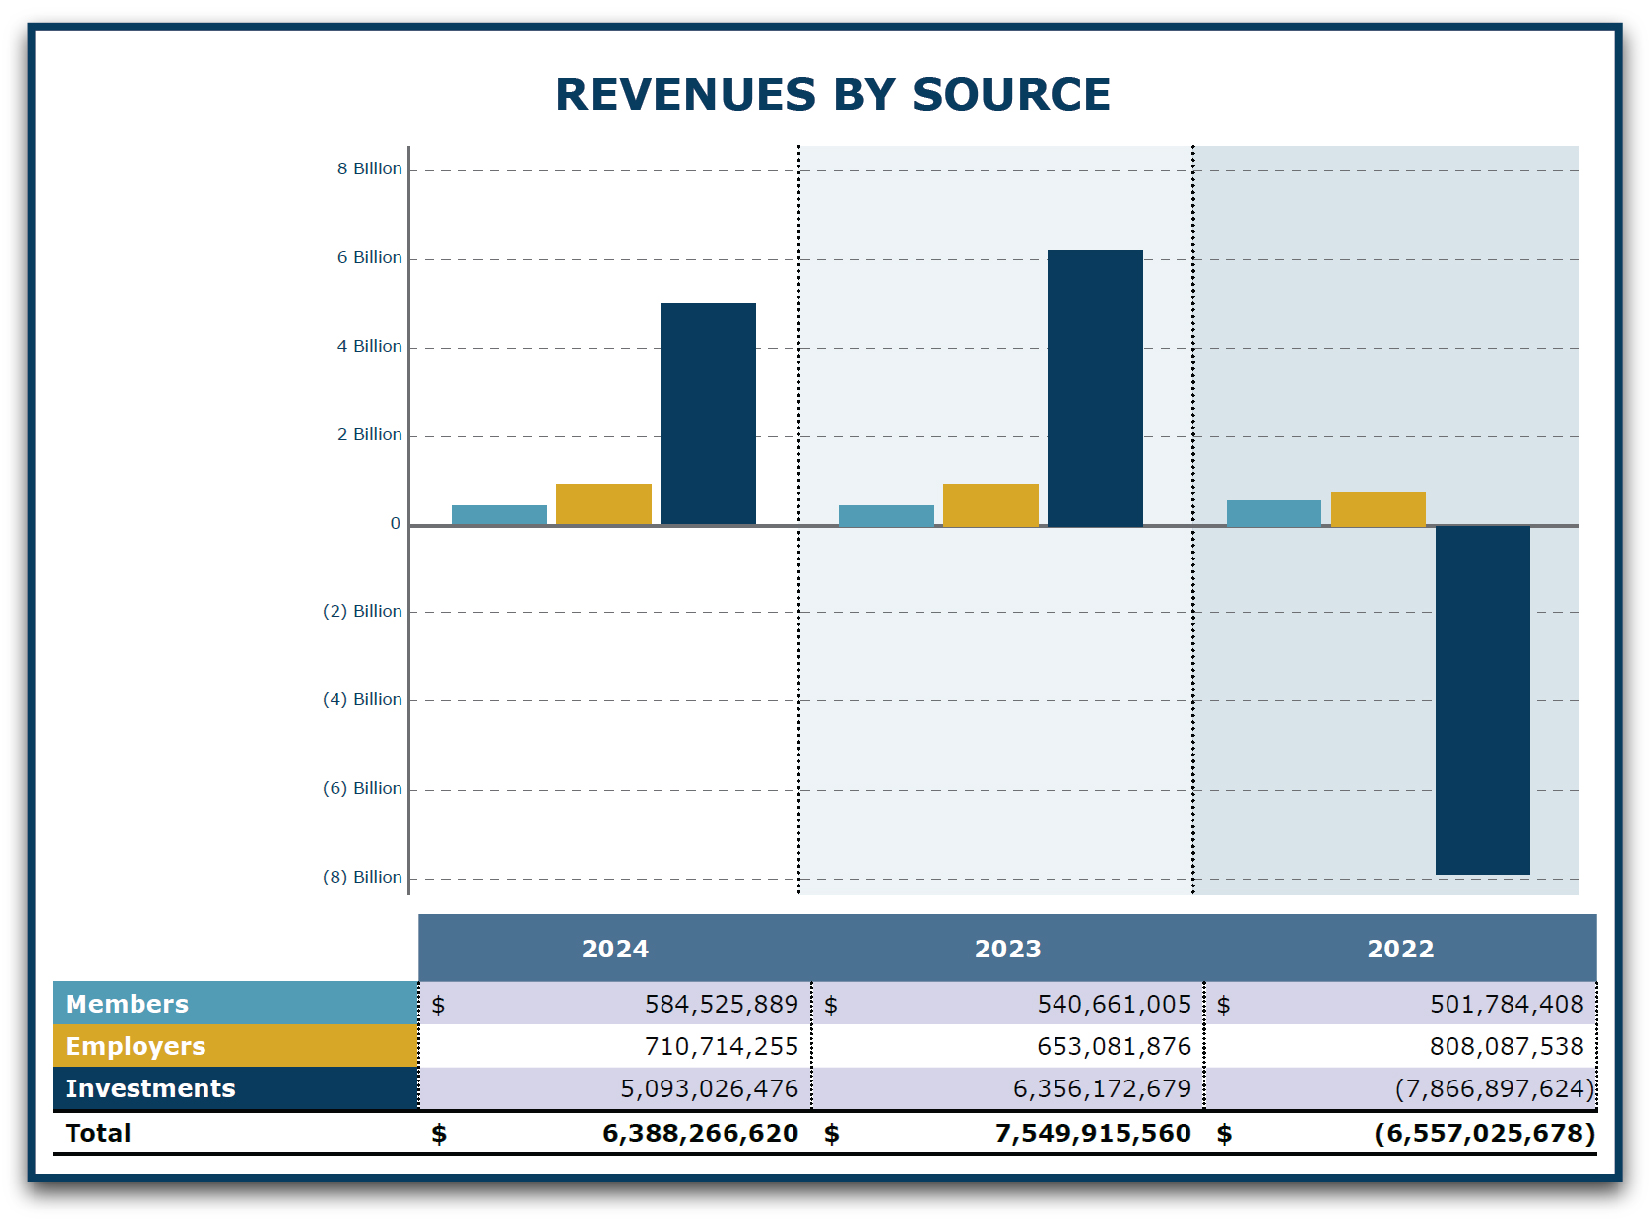
Revenue and Expenses
Revenues
IMRF’s revenue comes from 3 sources: member contributions, IMRF employer contributions (from participating units of government), and investment income. IMRF's total revenue in 2024 was $6.4 billion.
About 98% of IMRF members participate in the Regular Plan. These members pay 4.5% out of every paycheck to fund IMRF benefits. Total member contributions were more than $584 million in 2024.
All IMRF employers also make monthly payments to support the IMRF benefit system. Each IMRF employer pays an amount calculated by IMRF’s actuary based on its IMRF assets, liabilities, and the demographics of its workforce. Total employer contributions were $711 million in 2024.
Member and employer contributions are invested, and IMRF investment returns have historically accounted for the majority of IMRF’s revenue. In 2024, IMRF investments gained $5.1 billion.
As you can see from the 3-year comparison below, member and employer contributions remain stable while investment returns are historically strong but volatile.
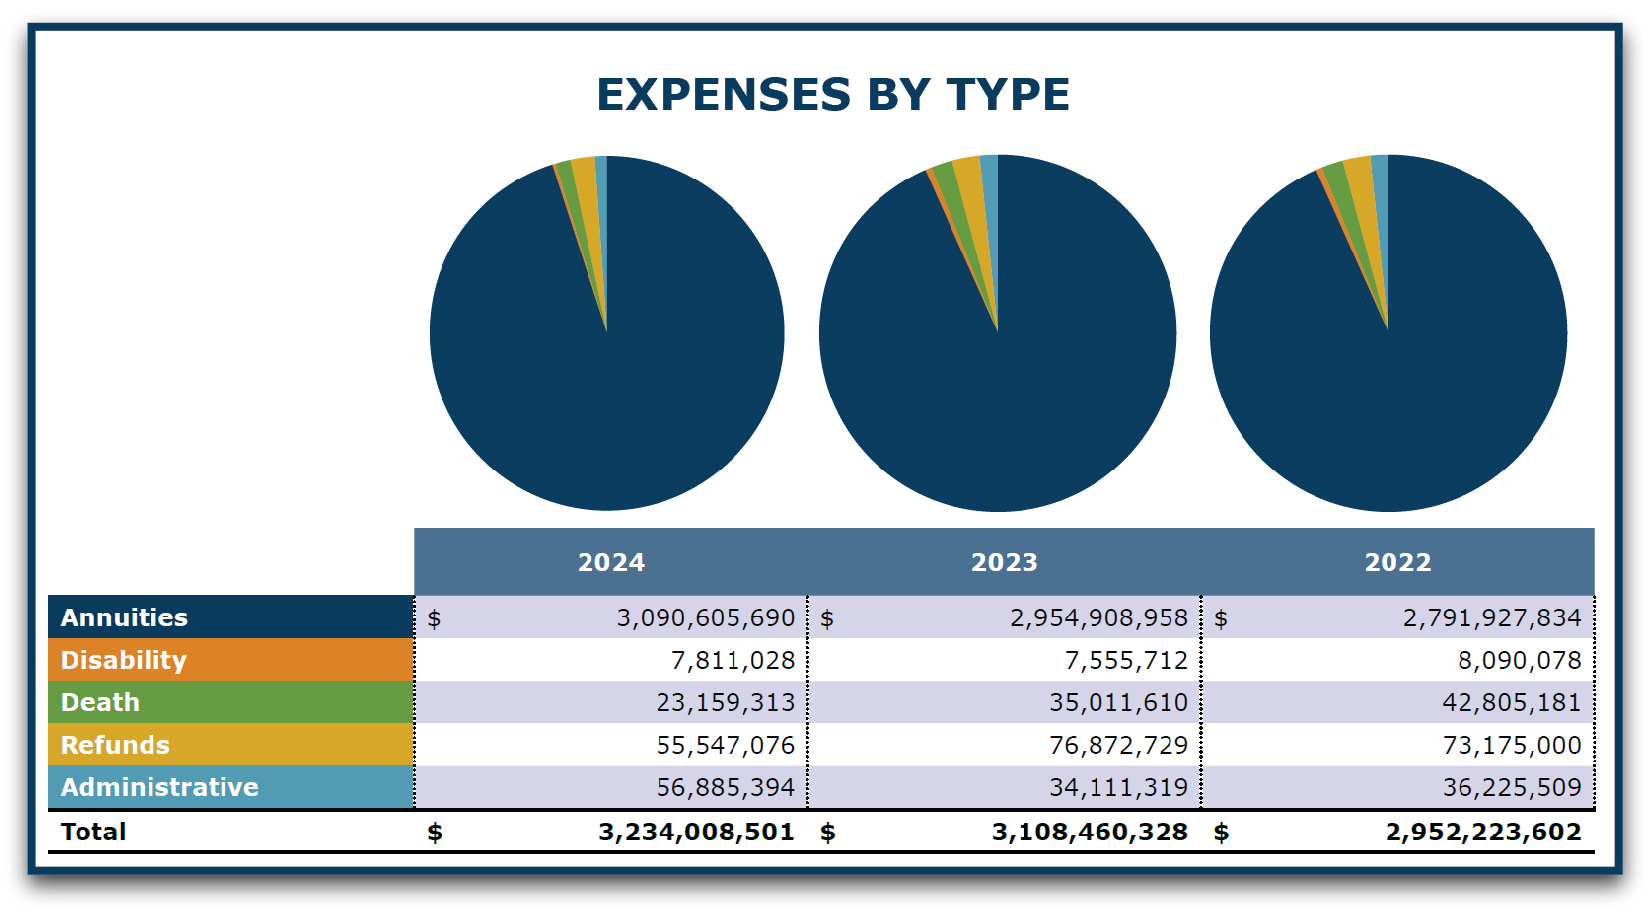
Expenses
IMRF’s expenses include annuities (pension payments), disability and death benefits, refunds to members, and the cost to administer IMRF’s benefit system. In 2024, IMRF’s total expenses equaled about $3.2 billion.
Total expenses increased by about 4.0% or $126 million from 2023 to 2024.
Members and Employers
IMRF experienced growth in members and an increase in employers in 2024.
Members
Over the last three years, IMRF members increased by 10.4%, totaling 524,304 active members, inactive members, and retirees in 2024.
| Members | 2024 | 2023 | 2022 |
|---|---|---|---|
| Active | 196,859 | 181,205 | 175,224 |
| Inactive | 169,066 | 157,200 | 148,128 |
| Retirees | 158,379 | 154,554 | 151,568 |
| Grand Total | 524,304 | 492,959 | 474,920 |
The typical IMRF retiree receives a modest benefit, earned after decades of public service.
| Annual Pension Amount | Annuitants |
|---|---|
| Under $1,200 | 6,200 |
| $1,200 to under $3,000 | 13,991 |
| $3,000 to under $6,000 | 24,719 |
| $6,000 to under $9,000 | 20,039 |
| $9,000 to under $12,000 | 15,513 |
| $12,000 to under $24,000 | 36,213 |
| $24,000 to under $36,000 | 17,200 |
| $36,000 to under $48,000 | 9,740 |
| $48,000 to under $60,000 | 5,902 |
| $60,000 to under $72,000 | 3,606 |
| $72,000 and over | 5,256 |
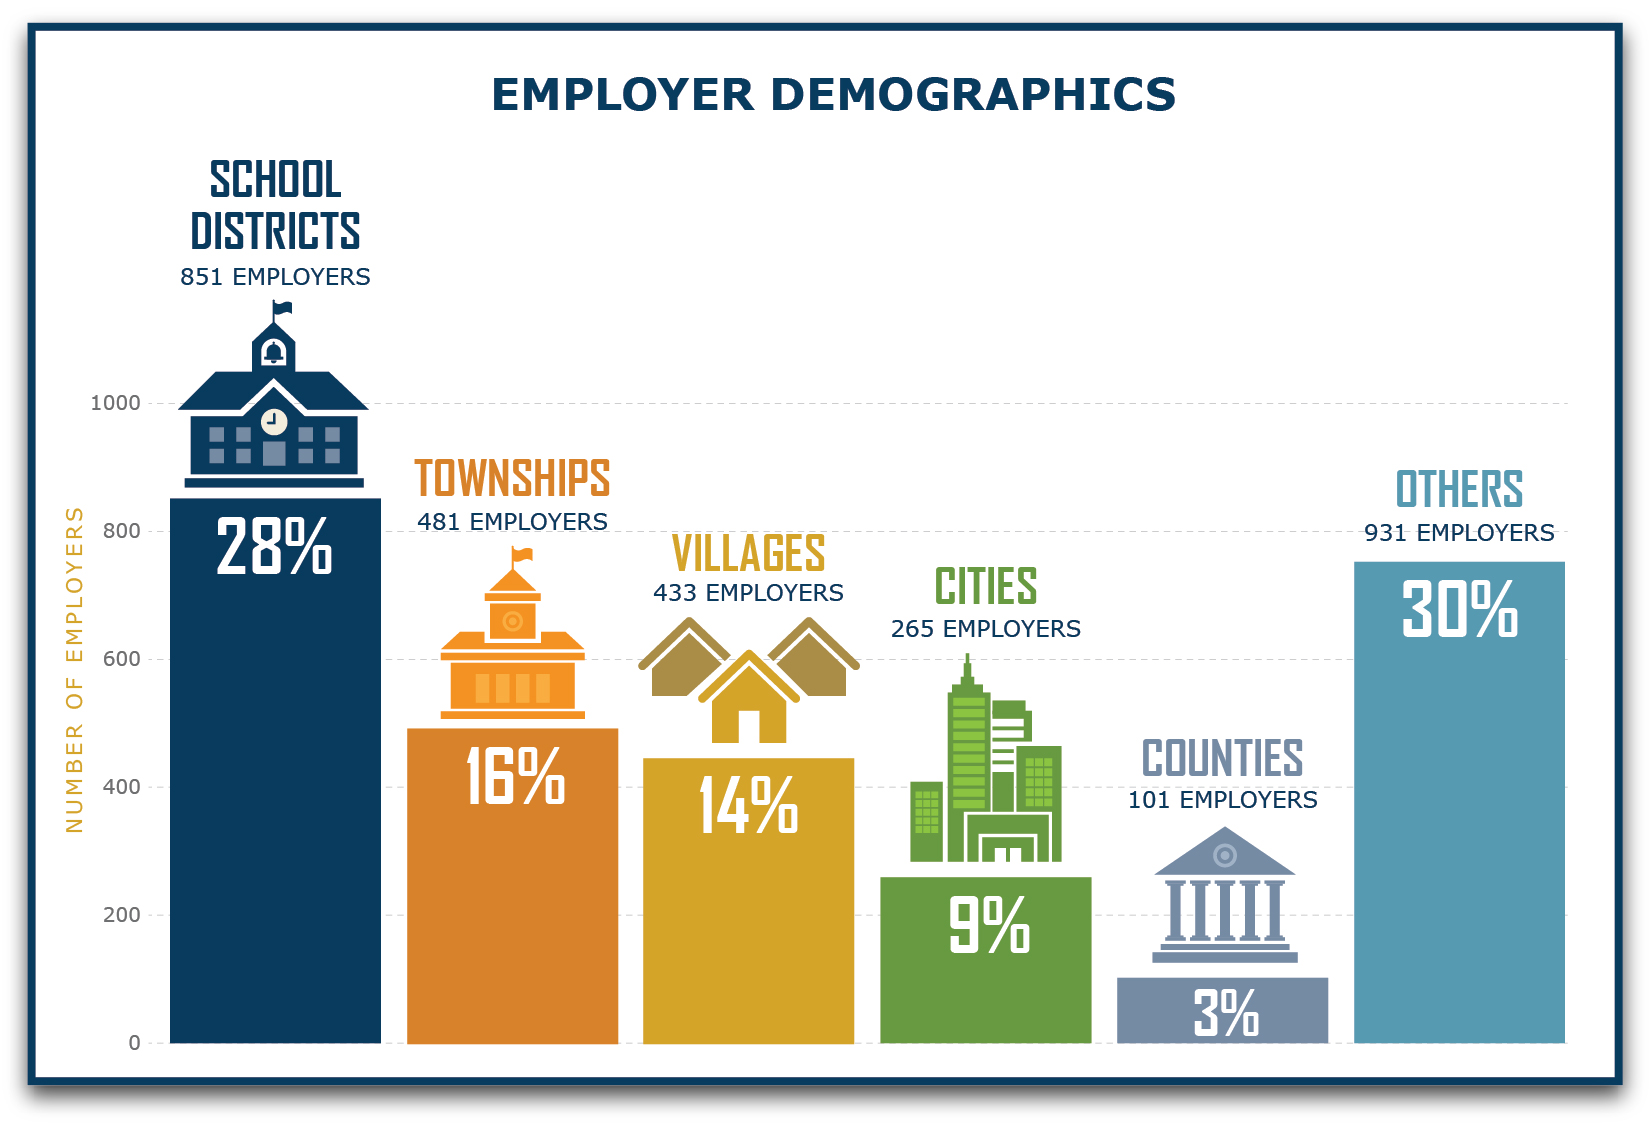
Employers
The Illinois Pension Code specifies the units of government required to participate in IMRF and those that may elect to join. In 2024, 3,062 units of government (employers) participated in IMRF, compared to 2,972 in 2015.
| Calendar Year End | Cities | Villages | Counties | School Districts | Townships | Other | Total |
|---|---|---|---|---|---|---|---|
| 2024 | 265 | 433 | 101 | 851 | 481 | 931 | 3,062 |
| 2015 | 259 | 415 | 101 | 850 | 478 | 869 | 2,972 |
 At IMRF, we REAACH for our goals
IMRF's values guide us to reach our mission, vision, and goals. They define how we work and shape the expectations we have for our organization. Through our commitment to these values, our members, employers, and stakeholders across Illinois and beyond can feel confident in IMRF as a world-class pension provider.

 IMRF Board of Trustees
Responsible for the prudent management of IMRF’s retirement assets, our eight-member Board of Trustees includes:
- Four Executive Trustees elected by participating units of government
- Three Employee Trustees elected by participating IMRF members
- One Annuitant Trustee elected by IMRF annuitants
- Natalie Copper, who has served as Trustee since 2010, was elected to her fourth term as Employee Trustee. Her term will run through December 31, 2029.
- Jason Isaac was appointed to his first term as employee trustee. His term will run through December 31, 2025.
- Peter Stefan was appointed executive trustee after previously serving as employee trustee. His term will run through December 31, 2025.
- William Stafford was appointed annuitant trustee. Stafford previously served as executive trustee and annuitant trustee. His term will run through December 31, 2025.
- Brian Townsend was appointed to his first term as executive trustee. His term will run through December 31, 2025.
- IMRF completed all milestones for its new technology platform, which went live on March 4, 2024.
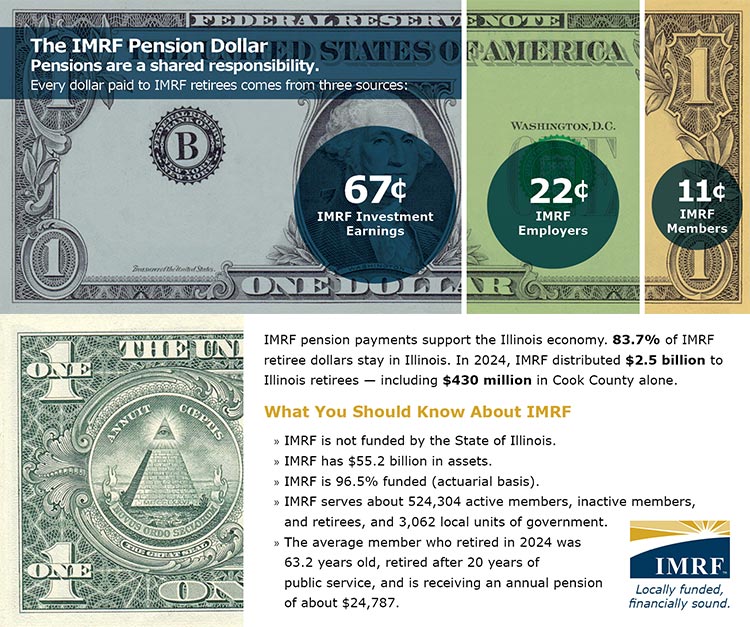
 2024 Pension Dollar
Pensions are a shared responsibility. Every dollar paid to IMRF retirees comes from three sources: investment earnings, employers, and members. View Full Size Pension Dollar.