
IMRF invites you to read our 2021 Popular Annual Financial Report (PAFR). Derived from IMRF's 2021 Annual Comprehensive Financial Report (ACFR), the PAFR is consistent with generally accepted accounting principles (GAAP) and shares a summary of our financial condition, highlighting key insights in five sections. Further details can be found in the ACFR. Click the links below to navigate to each section of our 2021 PAFR.
Fiduciary Net Position
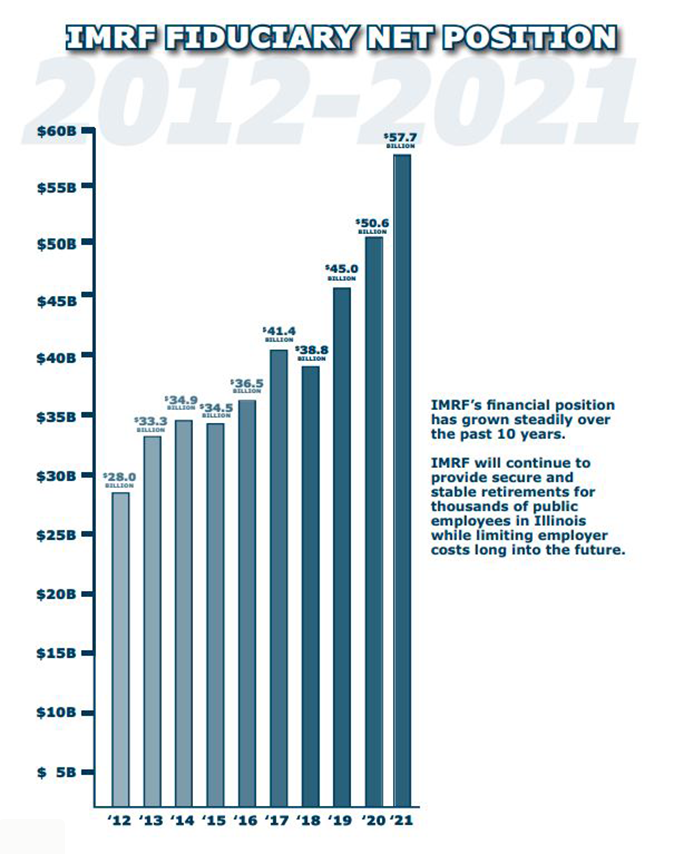
IMRF's fiduciary net position—total assets and deferred outflow of resources minus liabilities and deferred inflow of resources—was $57.7 billion as of December 31, 2021. That was an increase of $7.1 billion, or about 14.1%, from 2020. The increase is attributable to strong 2021 investment returns. The 2021 financial markets remained strong, boosted mostly from an improving economy and adapting to the impact of the pandemic.
Over the last 10 years, IMRF’s fiduciary net position has grown 106% - an addition of $29.7 billion.
Funding Status
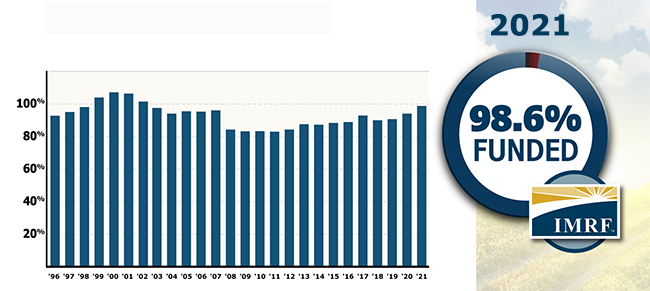
IMRF's funding status is a key indicator of our overall financial health. It reflects the percentage of benefit promises that IMRF has assets to pay. IMRF strives toward 100% funding because it guarantees that the system can meet its obligations and is most cost effective for taxpayers.
As of December 31, 2021, IMRF was 98.6% funded on an actuarial basis. IMRF's actuarial funding status is determined by independent actuaries using a "smoothing" technique that recognizes investment gains and losses over a five-year period. The actuarial funding status is used to set IMRF contribution rates for participating units of government. Below you will see that over the last 10 years IMRF's funded status has held strong above 85% dating back to 2013.
Investments
IMRF’s investment portfolio was valued at $57.3 billion on December 31, 2021.
The portfolio returned 16.63% after investment management fees during 2021. This return increased the value of the portfolio by $7.0 billion from December 31, 2020.
Domestic stocks marched steadily upward in 2021. Investor confidence in continued global economic growth helped all major asset classes post positive returns.
IMRF’s U.S. Stock portfolio performed particularly well during 2021 recording 24.7% return. The international stock portfolio returned 9.4% compared to 7.8% for IMRF's benchmark.
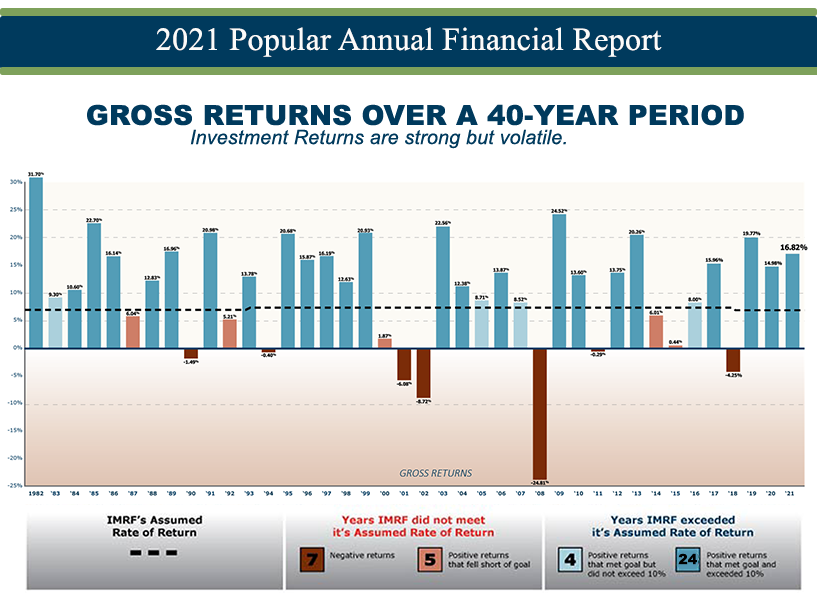
IMRF’s current long-term goal is to earn an annualized total fund return of 7.25%, after investment-management fees. With a return of 16.63% in 2021, IMRF achieved its goal. IMRF has also achieved its investment return goal over longer time horizons. For example, over the last 5 years, IMRF has earned 12.1% after paying investment-management fees. The bar chart below shows IMRF’s returns over the past 40 years compared to our assumed rate of return.
2021 Target vs. Actual Asset Allocation
The IMRF Board of Trustees revised the target asset allocation for the IMRF investment portfolio in 2021. The target allocation has two key goals: maximize return and minimize risk. The Board continually evaluates the portfolio’s target asset allocation and makes adjustments as necessary.
As the value of the assets fluctuates, the portfolio’s actual allocation always varies from the target. The goal is for the actual allocation to be within 4% of the target within each asset class.
On December 31, 2021, the portfolio’s actual allocation was within the prescribed range for all asset classes.
Revenue and Expenses
Revenue
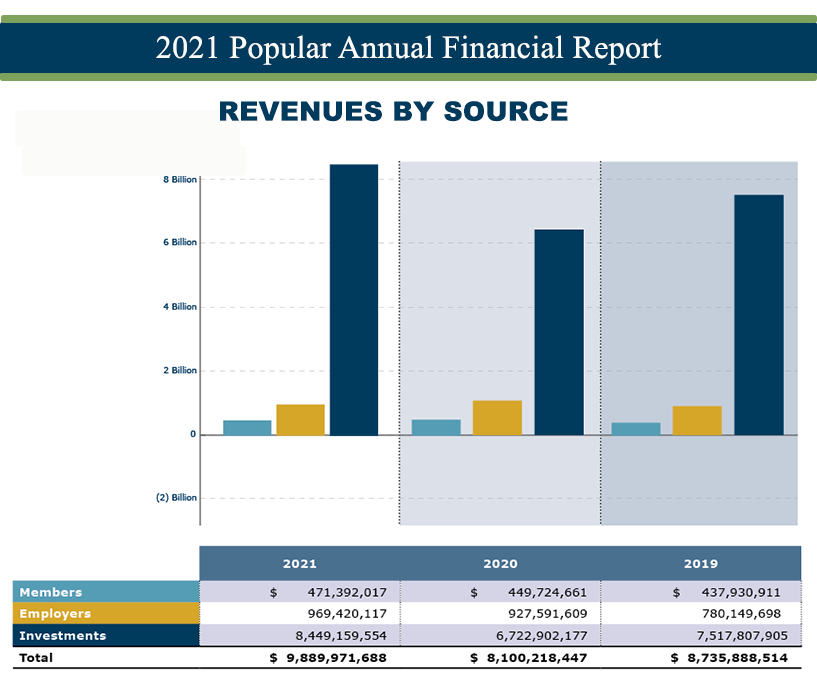
IMRF’s revenue comes from member contributions, contributions from participating units of government (also called IMRF employers), and investment income. IMRF’s total revenue during 2021 was $9.9 billion.
About 98% of IMRF members participate in the Regular Plan. These members pay 4.5% out of every paycheck to fund IMRF benefits. Total member contributions were more than $471 million in 2021.
All IMRF employers also make monthly payments to support the IMRF benefit system. Each IMRF employer pays an amount calculated by IMRF based on its IMRF assets, liabilities, and the demographics of its workforce. Total employer contributions were $969 million in 2021.
Member and employer contributions are invested. Historically, IMRF investments account for the majority of IMRF’s revenue. This was true in 2021, when IMRF investments generated $8.4 billion in revenue.
As you can see from the 3 year comparison below member and employer contributions remain stable while investment returns are strong but volatile.
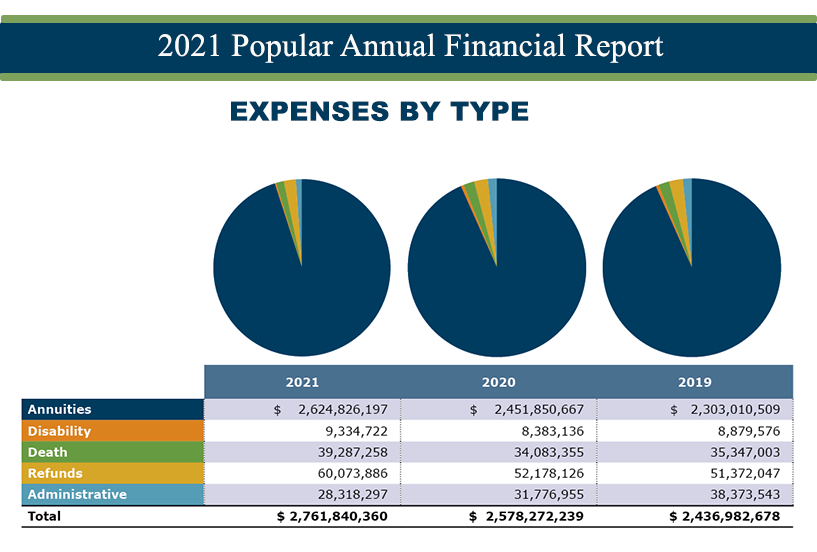
Expenses
IMRF's expenses include annuities (pension payments), disability and death benefits, refunds to members, and the cost to administer IMRF’s benefit system. In 2021, IMRF’s total expenses equaled about $2.8 billion.
Total expenses increased by about $184 million from 2020 to 2021, or about 7.1%.
Members and Employers
IMRF experienced growth in both members and employers in 2021.
Members
Members increased by 4.0% over the last three years to a total of 457,835 active members, inactive members, and retirees in 2021.
| Members | 2021 | 2020 | 2019 |
|---|---|---|---|
| Active | 172,310 | 170,735 | 177,809 |
| Inactive | 138,391 | 129,779 | 124,170 |
| Retirees | 147,134 | 142,329 | 138,089 |
| Grand Total | 457,835 | 442,843 | 440,068 |
The typical IMRF retiree receives a modest benefit, earned after decades of public service. In 2021, out of IMRF’s 147,134 retirees, less than 2.4% of retirees receive $72,000 or more annually.
Distribution of Annuitants by Pension Amount
| Annual Pension Amount | Annuitants |
|---|---|
| Under $1,200 | 6,244 |
| $1,200 to under $3,000 | 14,777 |
| $3,000 to under $6,000 | 24,533 |
| $6,000 to under $9,000 | 18,822 |
| $9,000 to under $12,000 | 14,025 |
| $12,000 to under $24,000 | 31,044 |
| $24,000 to under $36,000 | 14,058 |
| $36,000 to under $48,000 | 7,579 |
| $48,000 to under $60,000 | 4,357 |
| $60,000 to under $72,000 | 2,513 |
| $72,000 and over | 3,356 |
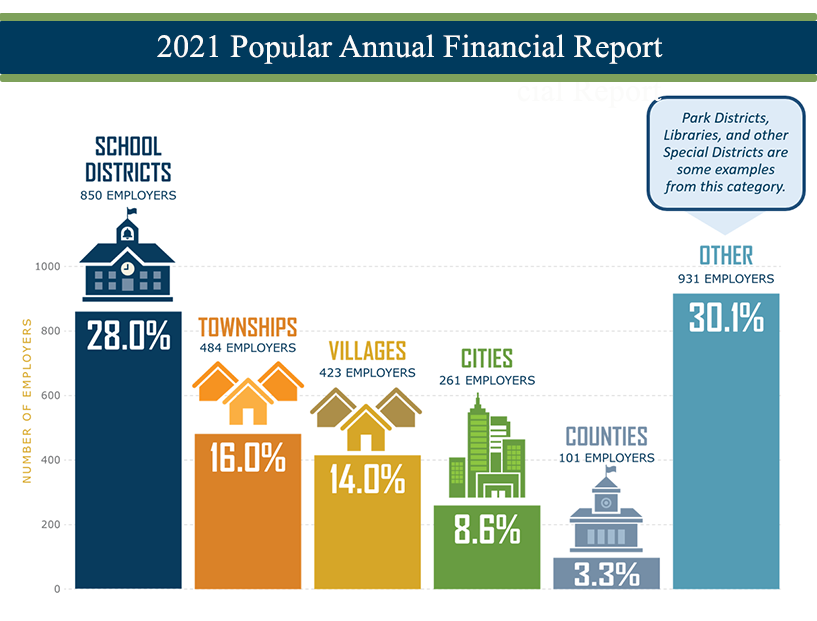
Employers
The Illinois Pension Code specifies the units of government required to participate in IMRF and those that may elect to join. In 2021, 3,032 units of government (employers) participated in IMRF, compared to 2,969 in 2012.
| Calendar Year End | Cities | Villages | Counties | School Districts | Townships | Other | Total |
|---|---|---|---|---|---|---|---|
| 2021 | 261 | 423 | 101 | 850 | 484 | 913 | 3,032 |
| 2012 | 258 | 411 | 101 | 859 | 479 | 861 | 2,969 |
 At IMRF, we REAACH for our goals
IMRF's values guide us to reach our mission, vision, and goals. They define how we work and shape the expectations we have for our organization. Through our commitment to these values, our members, employers, and stakeholders across Illinois and beyond can feel confident in IMRF as a world-class pension provider.
 IMRF Board of Trustees
Responsible for the prudent management of IMRF’s retirement assets, our eight-member Board of Trustees includes:
- Four Executive Trustees elected by participating units of government
- Three Employee Trustees elected by participating IMRF members
- One Annuitant Trustee elected by IMRF annuitants
- The Government Finance Officers Association (GFOA) awarded IMRF its prestigious "Triple Crown" Award for receiving all three GFOA Certificates of Achievement for Excellence in Financial Reporting for the Annual Comprehensive Financial Report (ACFR), Popular Annual Financial Report (PAFR), and Budget.
- David Miller, who has served as Trustee since 2016, was elected to his second term as Executive Trustee. His second term will run from January 1, 2022, through December 31, 2026
- Six bills that affect IMRF passed the General Assembly in 2021:
Public Act 102-0097: Creates an exemption to the bid process for emerging managers through a Manager of Managers program. Public Act 102-0210: In the provision applicable to IMRF, it moves the Tier 2 language and removes a state audit requirement. The act sets an age for required minimum distribution and allows certain SERS transfers of service. Public Act 102-0637: Adds the Firefighters' and Police Officers' Pension Investment Funds to the list of entities eligible to participate in IMRF. Public Act 102-0113: Allows active members of an Article 3 police pension fund to transfer qualifying IMRF service to their Article 3 police pension fund. Public Act 102-0603: Prohibits trustees from being employed by that pension fund for one year after he or she is no longer a trustee. Public Act 102-0479: Prohibits candidates who meet the criteria to serve as an Executive Trustee from serving as an Employee Trustee. - IMRF continued progress on a multi-year effort to update its technology platform. The project is expected to be completed in 2022.
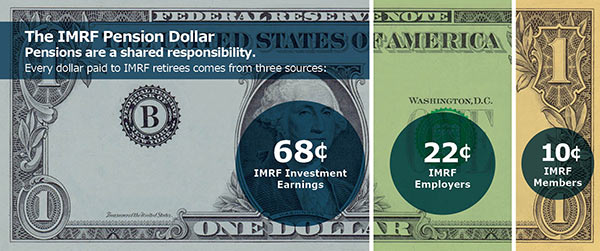
 2021 Pension Dollar
Pensions are a shared responsibility. Every dollar paid to IMRF retirees comes from three sources: investment earnings, employers, and members. View Full Size Pension Dollar.