These investment results are calculated and presented using standard performance evaluation methods in a manner consistent with the investment industry in general and public pension funds in particular. Rates of return were determined using a modified time-weighted return calculation.
Investment Returns Summary
| for Periods Ending March 31, 2026 | Quarter Ending |
Year to Date | 1 Year Ending |
3 Years Ending |
5 Years Ending |
10 Years Ending |
|---|---|---|---|---|---|---|
|
Total Fund The Total Fund Benchmark is a blend of the asset class benchmark returns weighted by the target allocation for each asset class. |
||||||
| Gross of Fees | 0.65% | 0.65% | 14.50% | 11.19% | 7.10% | 9.19% |
| Net of Fees | 0.61% | 0.61% | 14.35% | 11.02% | 6.93% | 9.00% |
| Total Fund Benchmark | (0.53%) | (0.53%) | 14.72% | 12.18% | 7.34% | 8.73% |
| Domestic Equity The Domestic Equity Benchmark is currently 93% Russell 3000 Index, 7% FTSE Global Core Infrastructure 50/50 Index (Net). Returns prior to March 1, 2022, reflect those of the Russell 3000 Index. Returns prior to January 1, 2015, reflect those of the Dow Jones U.S. Total Stock Market Index. |
||||||
| Gross of Fees | (2.43%) | (2.43%) | 15.97% | 15.57% | 9.10% | 12.86% |
| Net of Fees | (2.46%) | (2.46%) | 15.82% | 15.41% | 8.94% | 12.66% |
| Domestic Equity Benchmark | (3.01%) | (3.01%) | 18.28% | 17.48% | 10.74% | 13.65% |
| International Equity | ||||||
| Gross of Fees | 0.47% | 0.47% | 26.26% | 16.33% | 8.12% | 9.42% |
| Net of Fees | 0.38% | 0.38% | 25.90% | 15.95% | 7.75% | 9.05% |
| MSCI ACWI Ex-U.S. Index | (0.71%) | (0.71%) | 24.91% | 14.49% | 7.02% | 8.38% |
| Fixed Income The Fixed Income Benchmark is currently 82% Bloomberg U.S. Aggregate, 10% Custom Barings Global Loan Benchmark, and 8% ICE BofAML U.S. High Yield Cash Pay Index. Returns prior to March 1, 2022, reflect those of the Bloomberg U.S. Aggregate. |
||||||
| Gross of Fees | (0.05%) | (0.05%) | 4.80% | 4.94% | 1.50% | 2.81% |
| Net of Fees | (0.07%) | (0.07%) | 4.70% | 4.80% | 1.38% | 2.67% |
| Fixed Income Benchmark | (0.11%) | (0.11%) | 4.61% | 4.58% | 1.22% | 2.16% |
|
Real Estate The Real Estate Benchmark is currently the NCREIF ODCE Index. Prior to January 1, 2013, it was the NCREIF Property Index + 1%. Returns prior to January 1, 2007, reflect those of the Consumer Price Index + 5%. |
||||||
| Gross of Fees | 0.03% | 0.03% | 3.11% | (0.58%) | 5.26% | 6.74% |
| Net of Fees | 0.03% | 0.03% | 3.04% | (0.66%) | 5.18% | 6.69% |
| Real Estate Benchmark | 1.04% | 1.04% | 3.11% | (2.81%) | 2.34% | 3.79% |
|
Alternative Investments The Alternatives Benchmark is currently 87% MSCI World World Index (Net) 1 Qtr Lagged +3%, 13% S&P LSTA Leveraged Loan 100 Index +2%. Prior to March 1, 2022 it was based on an annualized rate of return of 9%. Prior to July 1, 2010, it was based on an annual return of 12%. Prior to 2004, it was based on an annual return of 13%. Prior to 2003, it was based on an annual return of 15%. |
||||||
| Gross of Fees | 10.56% | 10.56% | 21.85% | 11.92% | 14.55% | 13.91% |
| Net of Fees | 10.56% | 10.56% | 21.85% | 11.92% | 14.55% | 13.84% |
| Alternatives Benchmark | 2.70% | 2.70% | 20.24% | 22.27% | 11.98% | 10.48% |
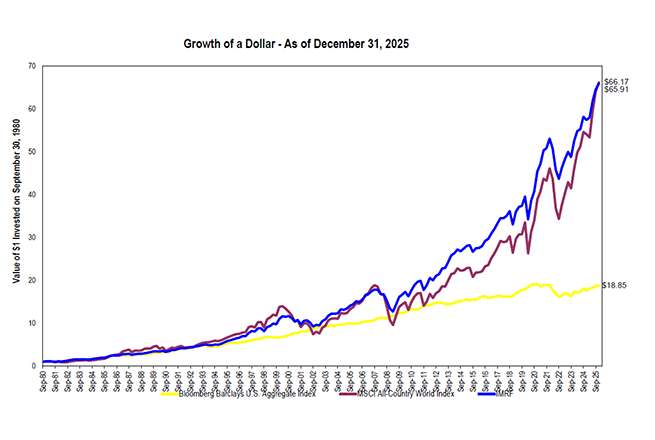
A dollar invested into IMRF
The chart below shows the growth of $1 invested in 1980 into the IMRF Total Fund compared to that of the global equity and U.S. fixed income markets. As illustrated, an investment in the IMRF Total Fund outperformed both broad market indices.